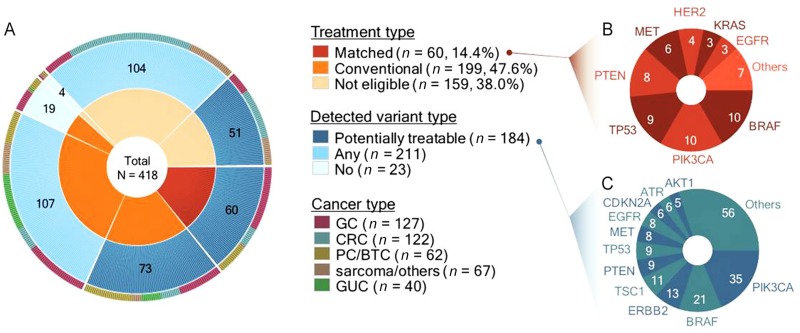
Figure 3.
Therapy distribution for 418 patients and the recurrently mutated genes. (A): The inner circle represents the patients undergoing different therapies, and the outer circle shows mutation‐variant distributions: potentially treatable variants (blue), any variants (light blue), and no variants (grey) among the three groups. The right panel shows frequently detected genes representing (B) key genes in the matched‐therapy group and (C) genes with potentially treatable variants in all three groups. The number of patients is indicated in brackets.
Abbreviations: CRC, colorectal cancer; GC, gastric cancer; GUC, genitourinary cancer; PC/BTC, pancreatic/biliary tract cancer.

