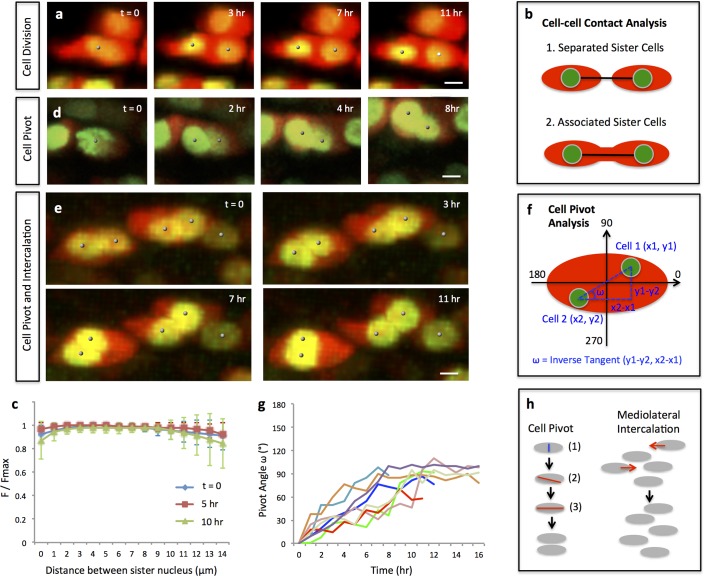
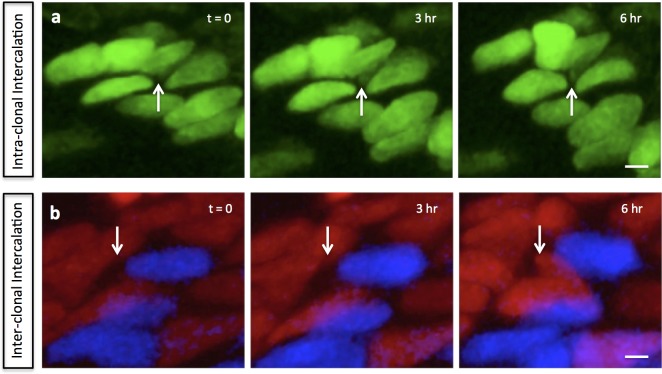
Figure 2. Single and multi-columns are generated by distinct cell rearrangements.
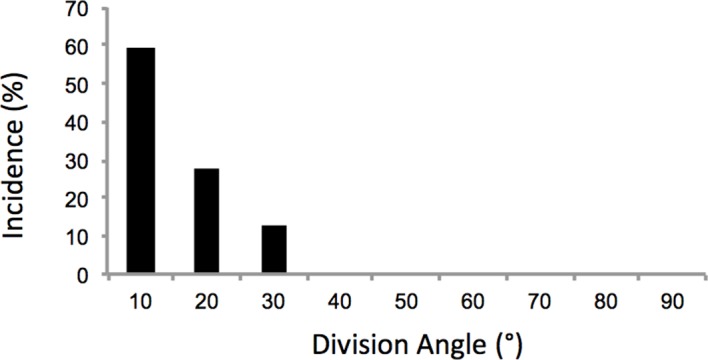
(a) Oriented cell division in the proliferative zone. Live imaging was performed on the chick metacarpal explants expressing H2B-GFP (green) and mCherry (red) via replication-competent avian retroviral (RCAS) infection. Sister cells appeared to be positioned orthogonal to the tissue proximodistal axis and physically coupled after cytokinesis. See also Figure 2—figure supplement 1. (b, c) Quantitative analysis of sister cell contact. Polyline kymograph analysis of the cytoplasmic mCherry intensity (red) was conducted between the nucleus of two sister cells (green). The intensity was divided by the maximum intensity found alone the line for normalization (F/Fmax). For individual dividing pairs, T = 0 was the time when two daughter nuclei formed. If sister cells separate later (b-1), the F/Fmax curve should display an inversed bell shape; if the F/Fmax curve remains flat, it means the two cells are physically associated (b-2). This method confirmed sister cells remained in contact 10 hr after cytokinesis (n = 5) (c). See also Figure 2—source data 1. (d, e) Snapshots of cell pivot and mediolateral intercalation in the proliferative zone. In d, one mother cell produced two daughters started to rearrange their relative positions (The signal intensity of the images in d was adjusted from the corresponding movie to present nucleus morphologies more clearly). In e, on the left, two laterally aligned sister cells (cell doublets) reorganized their orientations and consequently stacked into a single column; on the right, three cells underwent intercalation: they were arranged laterally positioned at time 0; afterwards, the right and left intercalated toward the middle at 11 hr. (f) Schematic diagram to show the calculation of pivot angle (ω) that is between the plane of sister cells and the mediolateral axis of the tissue. Imaging software IMARIS was used to generate the coordinates of the cells (x, y) that were further applied to the provided equation to calculate ω at different time points. (g) Sister cells underwent pivot. ω of individual sister pairs was plotted against time and presented as individual lines in the graph. T = 0 was the time when sister cells were started to be observed, and ω at this time point was normalized to 0° for the ease of comparison. Most pairs (7/8) were initially aligned lateral to each other (low ω at time 0) and then underwent pivot (progressive increase of ω) into a single column (ω was between 70–100°) along the tissue proximodistal axis (n = 8). The maximal limit of y axis was set to 180° because the pivot angles of some cells were larger than 90°. Noticeably, one pair underwent partial pivot for about 50° only (red line). See also Figure 2—source data 2. (h) Schematic diagrams showing how distinct types of cell rearrangements generating corresponding columns: cell pivot behavior produces single columns whereas intercalation refines multi-columns. The blue and red lines stand for cleavage furrow and post-cleavage furrow, respectively. Scale bars: 4 μm.
Figure 2—figure supplement 1. Oriented cell division in the proliferative zone.


