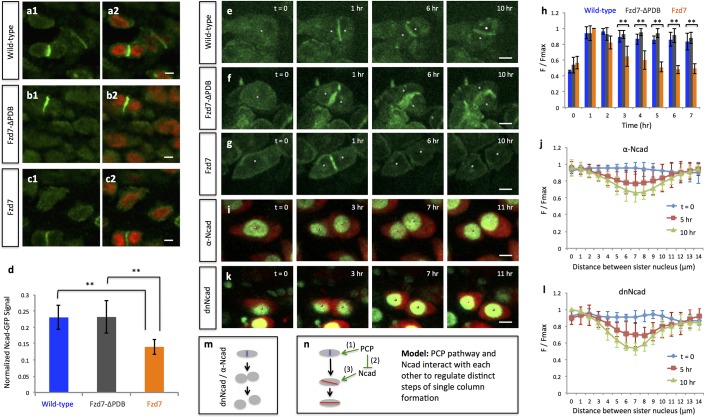
Figure 6. PCP signaling controls cell pivot by maintaining the local concentration of N-Cadherin.
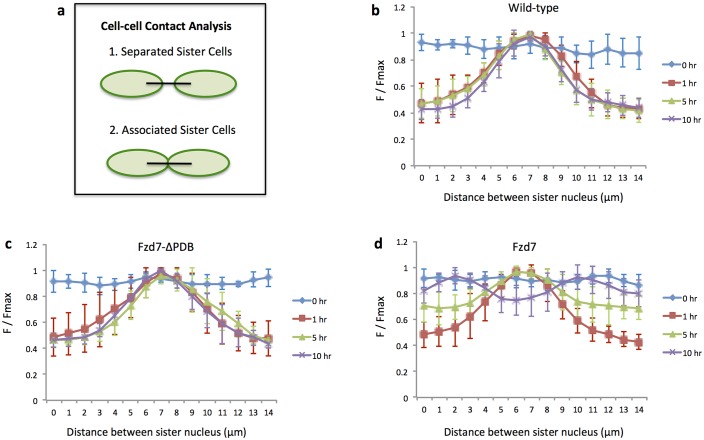
(a–d) Immunofluorescence with α-N-Cadherin (Ncad) antibody (green) and DAPI (red) in the frozen sections of wild-type tissues demonstrated that Ncad was present both on the membrane and in the cytoplasm, particularly enriched in cell-cell junctions (a). These patterns appeared to be unchanged in Fzd7-ΔPDB (b) or Fzd7 expressing cells (c). However, junctional Ncad in Fzd7 positive tissues was reduced (c). This was confirmed by normalizing junctional Ncad intensity to total Ncad intensity in each pair of sister cells (d) (n = 10, 10, eight for wild-type, Fzd7-ΔPDB, and Fzd7 tissues, respectively). See also Figure 6—source data 1. (e–g) In the chick metacarpals expressing Ncad-GFP (green) via RCAS infection, live imaging revealed that the fusion protein was enriched in the interface of sister cells in wild-type tissues (e) (n = 6) and tissues coexpressing Fzd7-ΔPDB (n = 6) over time (f). In contrast, in the presence of Fzd7, Ncad was initially concentrated in the junctions but then diminished as the cytoplasmic bridge between sister cells disconnected (g) (n = 7). (h) Quantifying Ncad-GFP expression along the post-cleavage furrow. GFP intensity was measured every one hour after cell division (T = 1 hr was the time when junctional Ncad-GFP was started to be observed) and normalized by dividing the maximal intensity during the time course (F/Fmax). Changes of cumulative F/Fmax showed that Ncad-GFP signal in Fzd7 expressing cells dropped about 50% 5 hr after cytokinesis. See also Figure 6—source data 2. (i–l) The normal function of Ncad is required for maintaining sister cell contact. Live imaging was performed on H2B-GFP (green) and mCherry (red) positive tissues cultured in the medium with α-Ncad antibody (1:10 dilution) (i), demonstrating the disengagement of sister cells (j) (n = 5). Similar cell behaviors were observed in the tissues expressing H2B-GFP (green) and a dominant-negative mutant of Ncad fused to mCherry through T2A sequence (red) (k, l) (n = 5). The signal intensity of the images in i was adjusted from the corresponding movie to present nuclei morphologies more clearly. In both cases, no complete pivoting was observed in cell doublets (n = 15 and 20 for α-Ncad antibody and dnNcad-T2A-mCherry, respectively). See also Figure 6—source data 3, Figure 6—source data 4. (m) Schematic diagram to show functional blocking of Ncad causes sister cells to separate. (n) Schematic diagram to summarize the roles of PCP signaling and junctional Ncad in regulating single column formation: (1) the absolute level PCP signaling is essential for oriented cell division, (2) PCP signaling reduces Ncad enrichment at the post-cleavage furrow, (3) normal junctional Ncad function is required for cell association and pivot. Scale bars: 4 μm. ** denotes p<0.01; * denotes p<0.05 (Wilcoxon Rank-Sum Test).


