. 2017 Oct 10;6:e27529. doi: 10.7554/eLife.27529

Figure 2. Pns11 interacts with OsSAMS1 and enhances its activity.

(A) Yeast two-hybrid assay for the interaction of Pns11 with OsSAMS1. The bait vector contained full-length Pns11; the prey vector contained OsSAMS1, OsSAMS2, or OsSAMS3. Yeast strains were cultured on the Trp –Leu –His –Ade selection medium. (B) Co-IP assay for the interaction of Pns11 with OsSAMS1. Pns11 and OsSAMS1 proteins were transiently expressed in Nicotiana benthamiana leaves for 3 days. Plant extracts were then immunoprecipitated using anti-Flag or anti-HA antibodies, separated on a 10% SDS-PAGE gel, and blotted with anti-Flag or anti-HA antibodies. (C) Luciferase complementation imaging assay for the interaction of Pns11 and OsSAMS1. Agrobacterium strain EHA105 harboring different construct combinations was infiltrated into different N. benthamiana leaf regions. After 3 days of infiltration, luciferase activities were recorded in these regions. Cps, signal counts per second. (D) In vivo pull-down assay confirmed the interaction between Pns11 and OsSAMS1 during RDV infection in rice using α-OsSAMS1 antibody. The red asterisks indicate the location of Pns11. Tissues were collected at 4 wpi. (E) Diagram of the assay. In the reaction, OsSAMS1 catalyzes a two-step reaction in the presence of Mg2+ and K+ that involves the transfer of the adenosyl moiety of ATP to methionine to form SAM and tripolyphosphate, which is subsequently cleaved to PPi and Pi. Conversion of L-[35S]-Met to SAM is activated by Pns11. (F) Coomassie brilliant blue staining of OsSAMS1 and Pns11 at the varying amounts of used in this assay. (G) Autoradiograph of a representative chromatogram showing SAM generated by OsSAMS1 in reactions containing varying molar ratios of maltose-binding protein (MBP)-Pns11 to OsSAMS1. The positions of labeled L-[35S]-Met substrate and SAM product are indicated. L-[35S]-Met and SAM in each reaction was calculated after phosphorimager quantitation of radioactivity in individual spots. (H) Stoichiometry of activation. The graph illustrates relative OsSAMS1 activity with increasing molar ratios of MBP-Pns11:OsSAMS1. Data were obtained from three independent experiments.

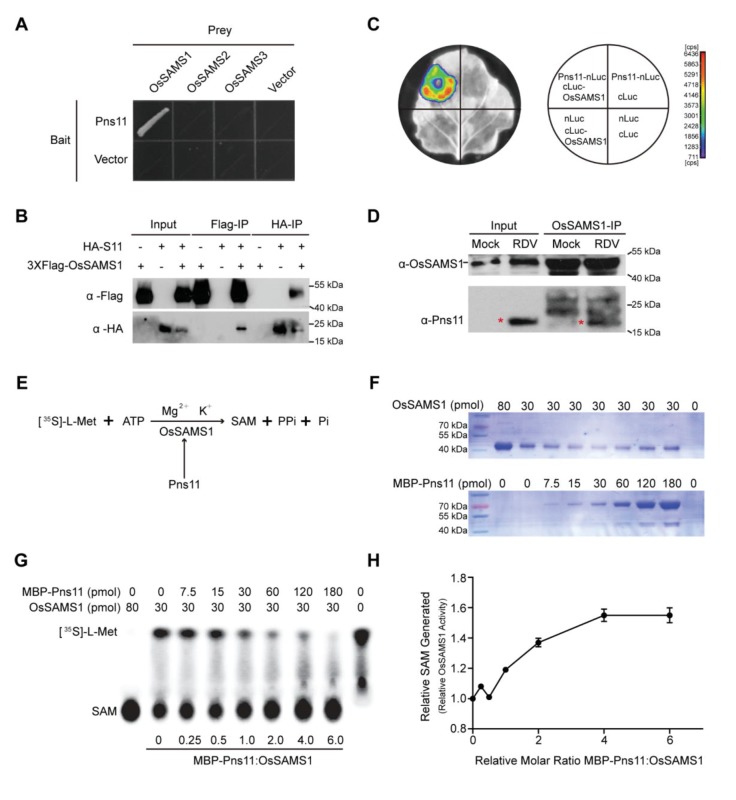
Figure 2.

Figure 2—figure supplement 1. RDV Pns11 specifically interacts with OsSAMS1 and does not affect OsSAMS1 expression.

Figure 2—figure supplement 1.

(A) Pns11 and OsSAMS1 specifically interact with each other in a yeast two-hybrid assay. (B) Co-IP assay for the interaction of Pns11 with OsSAMS2. Pns11 and OsSAMS2 proteins were transiently expressed in N. benthamiana leaves for 3 days, plant extracts were then immunoprecipitated using anti-Flag or anti-HA antibody, separated on a 10% SDS-PAGE gel, and blotted with anti-Flag or anti-HA antibody. (C) Co-IP assay for the interaction of Pns11 with OsSAMS3. Pns11 and OsSAMS3 proteins were transiently expressed in N. benthamiana leaves for 3 days, plant extracts were then immunoprecipitated using anti-Flag or anti-HA antibody, separated on a 10% SDS-PAGE gel, and blotted with anti-Flag or anti-HA antibody. (D) Real-time PCR of OsSAMS1 relative expression in S11 OX#11 and WT rice from 5, 6 and 10 leaf stages. The average (±standard deviation) values from three biological repeats are shown. The expression levels of the assayed genes were normalized to the expression level of OsEF-1α. (E) Western blot of OsSMS1 expression in S11 OX#11 and WT rice from 5, 6 and 10 leaf stages. Actin was probed and served as a loading control.
Figure 2—figure supplement 2. Pns11 and OsSAMS1 are co-localized in both nucleus and cytoplasm.

Figure 2—figure supplement 2.

Bimolecular fluorescence complementation (BiFC) interaction. Constructs expressing Pns11 and OsSAMS1 fused to the N- or C-terminal portions of yellow fluorescent protein (YFP) were delivered to N. benthamiana leaf cells by agroinfiltration. Cells were photographed 3 days post-infiltration at 40X magnification using a confocal laser scanning microscope. SV40T-mCherry was used as a marker for the nucleus. The co-expressed proteins are indicated above the photographs, which are representative of results with all possible combinations of fusion proteins. Bar = 20 μm.
Figure 2—figure supplement 3. Neither GFP nor P9 affects OsSAMS1 activity in vitro.

Figure 2—figure supplement 3.

(A) The upper graph represents the coomassie brilliant blue staining of varying amounts of OsSAMS1 and GFP, respectively. The middle graph is an autoradiograph of a representative chromatogram showing SAM generated by OsSAMS1 in reactions containing varying molar ratios of MBP-GFP to OsSAMS1. The positions of labeled L-[35S]-Met substrate and SAM product are indicated. L-[35S]-Met and SAM in each reaction was calculated after phosphorimager quantitation of radioactivity in individual spots. The lower graph is the stoichiometry of activation, which illustrates relative OsSAMS1 activity, with increasing molar ratio of MBP-GFP to OsSAMS1. Data were obtained from three independent experiments. (B) The upper graph represents the coomassie brilliant blue staining of varying amounts of OsSAMS1 and P9, respectively. The middle graph is an autoradiograph of a representative chromatogram showing SAM generated by OsSAMS1 in reactions containing varying molar ratios of MBP-P9 to OsSAMS1. The positions of labeled L-[35S]-Met substrate and SAM product are indicated. L-[35S]-Met and SAM in each reaction was calculated after phosphorimager quantitation of radioactivity in individual spots. The lower graph is the stoichiometry of activation, which illustrates relative OsSAMS1 activity, with increasing molar ratio of MBP-P9 to OsSAMS1. Data were obtained from three independent experiments.
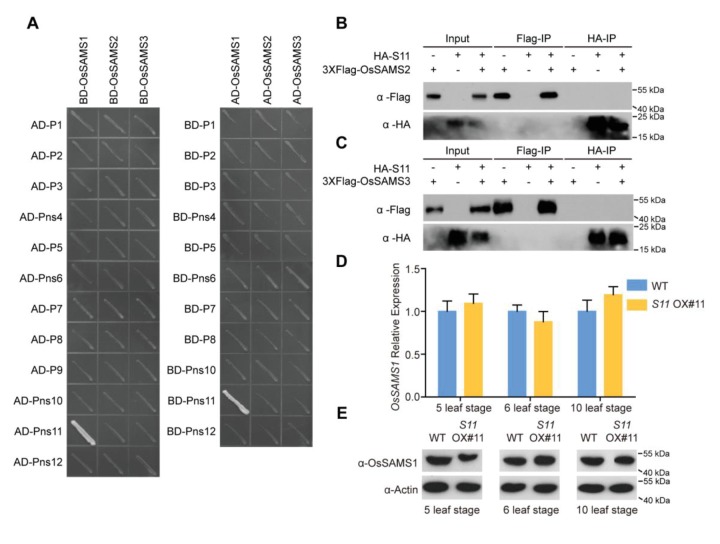
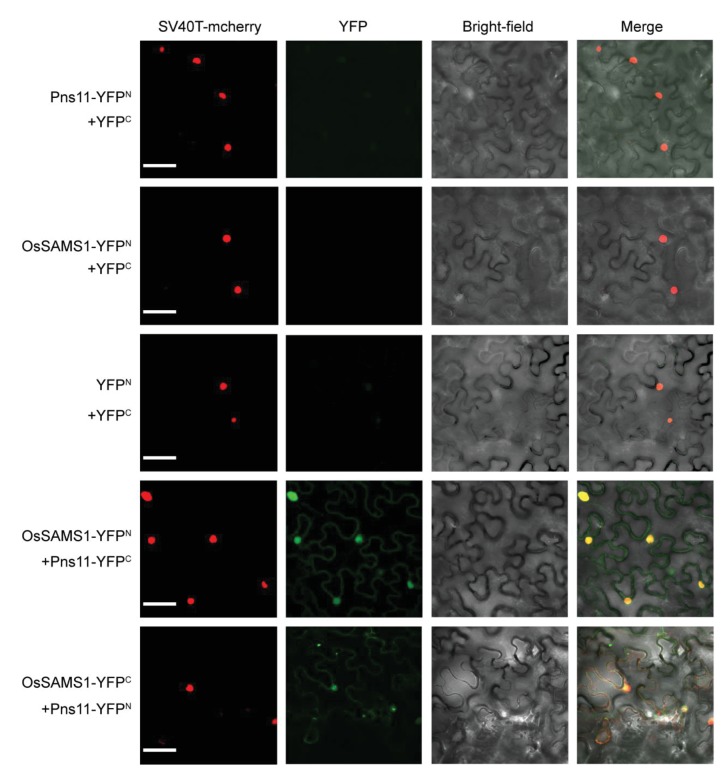
Figure 2—figure supplement 4. Pns11 does not affect OsSAMS2 activity in vitro.

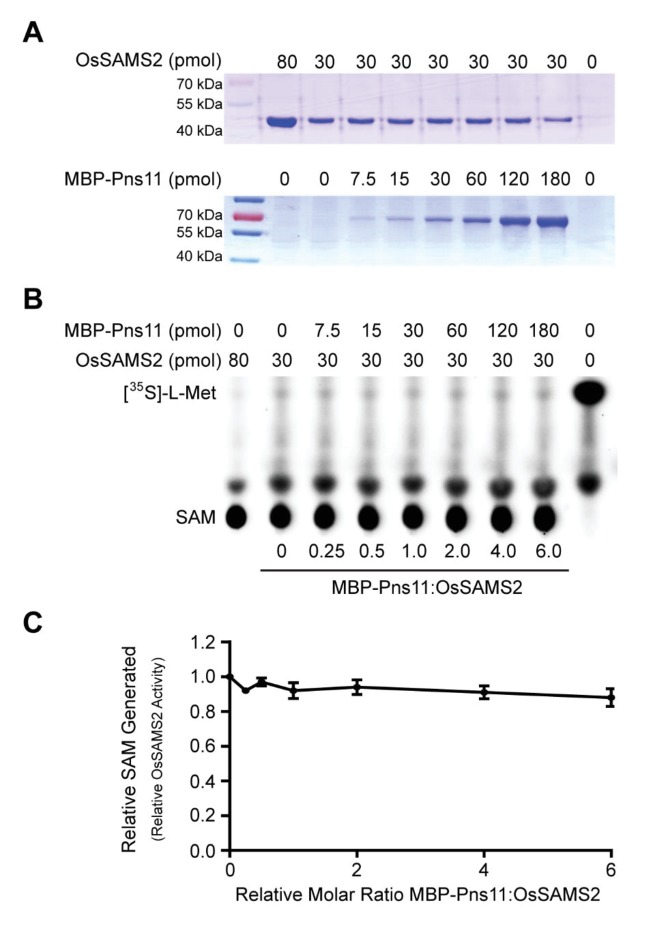
Figure 2—figure supplement 4.

(A) Coomassie brilliant blue staining of varying amounts of OsSAMS2 and Pns11, respectively. (B) Autoradiograph of a representative chromatogram showing SAM generated by OsSAMS2 in reactions containing varying molar ratios of MBP-Pns11 to OsSAMS2. The positions of labeled L-[35S]-Met substrate and SAM product are indicated. L-[35S]-Met and SAM in each reaction was calculated after phosphorimager quantitation of radioactivity in individual spots. (C) Stoichiometry of activation. The graph illustrates relative OsSAMS2 activity, with increasing molar ratio of MBP-Pns11 to OsSAMS2. Data were obtained from three independent experiments.
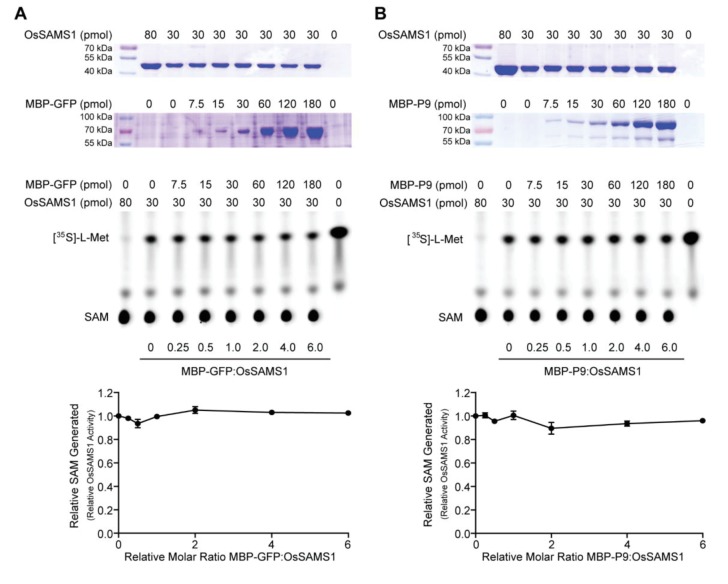
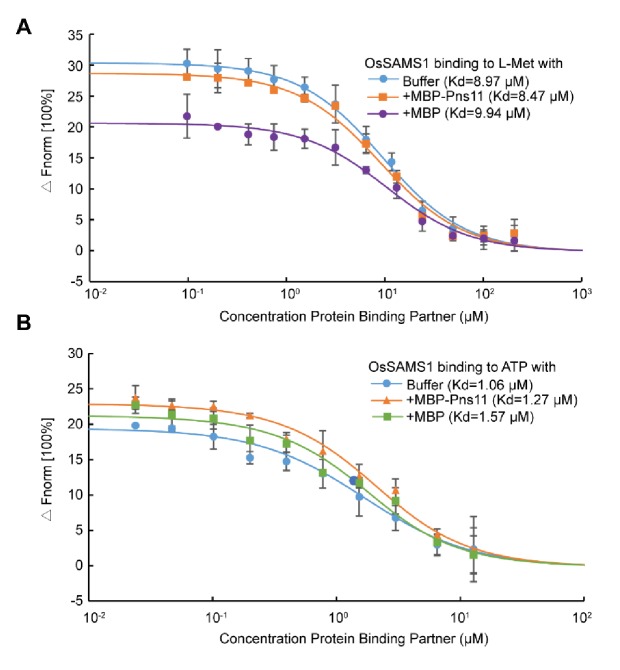
Figure 2—figure supplement 5. Pns11 does not affect the affinity of OsSAMS1 to the substrates L-Met or ATP.

Figure 2—figure supplement 5.

(A) Pns11 does not affect dynamic association between OsSAMS1 and L-Met. Data were collected from microscale thermophoresis (MST) assays as described in the 'Materials and methods'. Experiments were repeated three times and error bars indicate SD. Fnorm, normalized fluorescence. (B) Pns11 does not affect dynamic association between OsSAMS1 and ATP. Data were collected from MST assays as described in the 'Materials and methods'. Experiments were repeated three times and error bars indicate SD. Fnorm, normalized fluorescence.
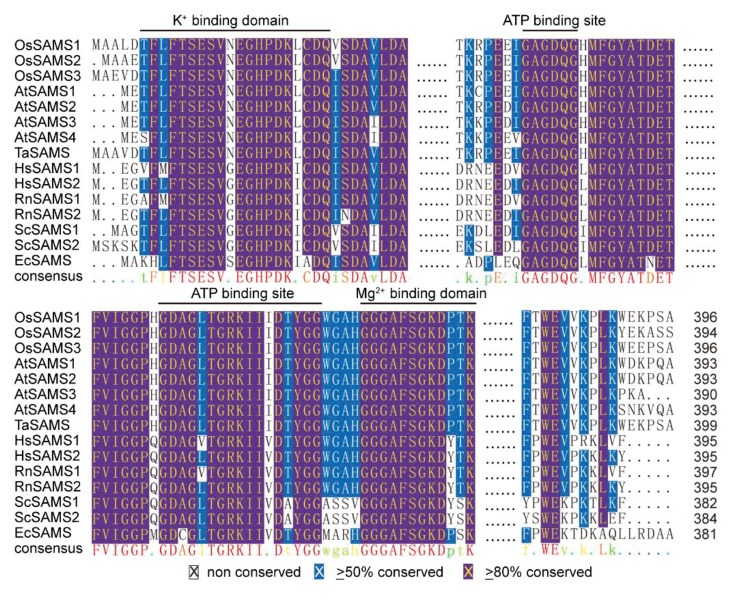
Figure 2—figure supplement 6. Multiple alignments of SAM synthetase proteins.

Figure 2—figure supplement 6.

Multiple alignments of SAM synthetase proteins. The amino acid secquence of OsSASM1 synthetase protein (Q0DKY4.1) were aligned with Oryza sativa SAM synthetase 2 (OsSAMS2, P93438.1), O. sativa SAM synthetase 3 (OsSAMS3, Q9LGU6.1), Arabidopsis thaliana SAM synthetase 1 (AtSAMS1, P23686.2), A. thaliana SAM synthetase 2 (AtSAMS2, P17562.1), A. thaliana SAM synthetase 3 (AtSAMS3, Q9SJL8.1), A. thaliana SAM synthetase 4 (AtSAMS4, Q9LUT2.1), Triticum aestivum SAM synthetase (TaSAMS, B0LXM0.1), Homo sapiens SAM synthetase 1 (HsSAMS1, Q00266.2), H. sapiens SAM synthetase 2 (HsSAMS2, P31153.1), Rattus norvegicus SAM synthetase 1 (RnSAMS1, P13444.2), R. norvegicus SAM synthetase 2 (RnSAMS2, P18298.1), Saccharomyces cerevisiae SAM synthetase 1 (ScSAMS1, P10659.2), S. cerevisiae SAM synthetase 1 (ScSAMS1, P19358.3), and Escherichia coli SAM synthetase (EcSAMS, P0A817.2). ≥50% conserved and ≥80% conserved amino acids were in blue and purple, respectively. Four SAM synthetase signature motifs were indicated. SAM code numbers are from UniProt.
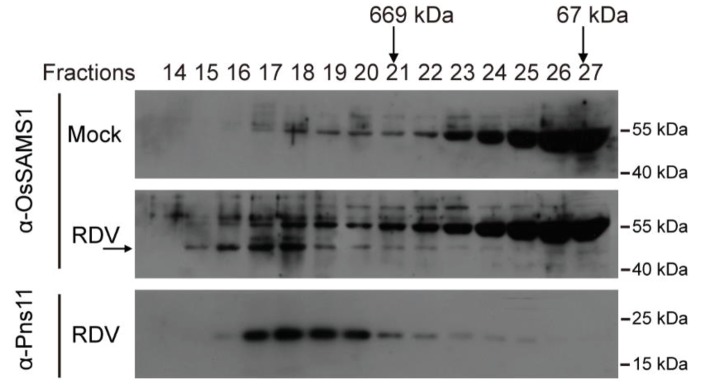
Figure 2—figure supplement 7. Gel-filtration analysis of Pns11 and OsSAMS1.

Figure 2—figure supplement 7.

Gel filtration analysis of Pns11 and OsSAMS1. The high-molecular-weight fraction peak of Pns11 and OsSAMS1 is indicated. The two vertical black arrows indicate fractions in which the 669-kDa and 67-kDa protein standards eluted. The horizontal black arrows indicate the location of OsSAMS1. Tissues were collected at 4 wpi.