. 2017 Oct 10;6:e27529. doi: 10.7554/eLife.27529

Figure 5. The ethylene-response mutant (osein2) shows increased tolerance of RDV infection whereas overexpression (OX) of OsEIN2 results in enhanced susceptibility.

(A) Symptoms of the mock-inoculated WT or RDV-infected WT (non-transgenic) plants, osein2, and OsEIN2-overexpression (OX) plants; images were taken at 4 wpi. Scale bars = 10 cm (upper panel) and 5 cm (lower panel). (B) Detection of RDV S2, S8, and S11 genomic segments in the mock-inoculated WT or RDV-infected WT (non-transgenic) plants, osein2, and OsEIN2 OX plants by northern blot. The blots were hybridized with radiolabeled riboprobes specific for each RNA segment. rRNAs were stained with ethidium bromide and served as loading controls. Tissues were collected at 4 wpi. (C) Detection of RDV P2, P8, and Pns11 proteins in the mock-inoculated WT or RDV-infected WT (non-transgenic) plants, osein2, and OsEIN2 OX plants by western blot. Actin was probed and served as a loading control. Tissues were collected at 4 wpi. (D) The incidences of infection, which were determined by visual assessment of disease symptoms at 0–8 wpi of 30 individual plants for each case. Means and standard deviations were obtained from three independent experiments.

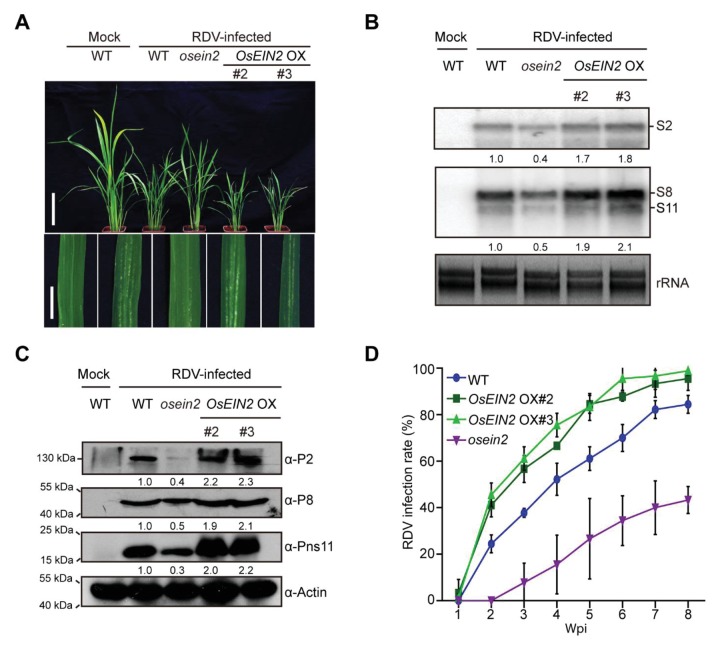
Figure 5.

Figure 5—figure supplement 1. Phenotype and identification of OsSAMS1 OE/osein2 (J119) transgenic lines.

Figure 5—figure supplement 1.

(A) Confirmation of osein2 and J119 lines by PCR-based analysis. (B) Western blot analysis of OsSAMS1 protein expression level in transgenic lines. Actin was probed and served as a loading control. The black square indicates protein OsSAMS1 with Flag tag, the black triangle indicates endogenous OsSAMS1 protein in rice. (C) Effect of air and ethylene on seed germination in the transgenic lines. Ethylene concentration was 10 ppm. Bar = 1 cm. (D) Comparison of seed size with (left panel) or without the hull (right panel) from WT, osein2 and J119 lines. (E) Statistical analysis of seed length and width of well-filled grains. Each value is an average for 8 plants and each plant has 100 grains. Bars indicate SD. Different letters indicate a significant difference between the compared pairs (p<0.05). (F) Phenotypic comparison of field-grown plants at the grain-filling stage. Bar = 15 cm.
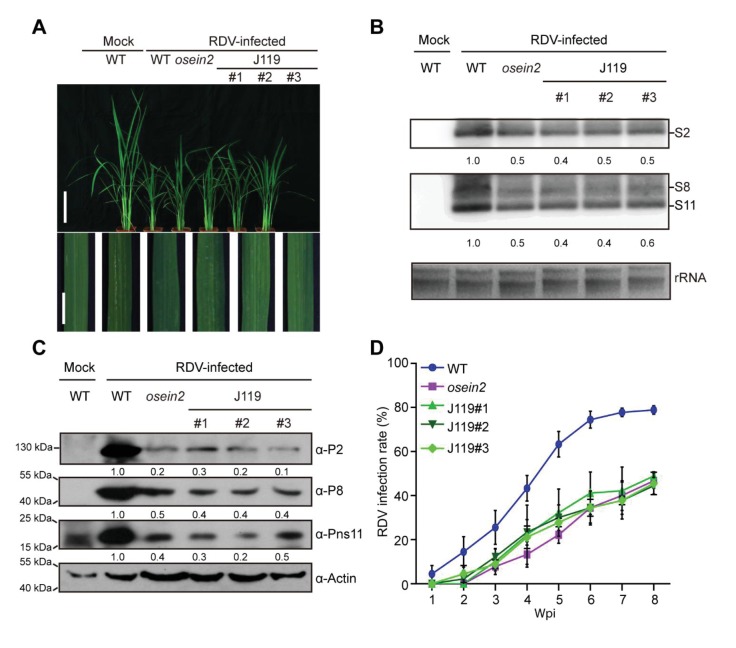
Figure 5—figure supplement 2. Overexpressed OsSAMS1 in osein2 (J119) results in increased tolerance of RDV infection.

Figure 5—figure supplement 2.

(A) Symptoms of the mock-inoculated WT or RDV-infected WT (non-transgenic), osein2 and J119 plants; images were taken at 4 wpi. Scale bars = 10 cm (upper panel) and 5 cm (lower panel). (B) Detection of RDV S2S8, and S11 genomic segments in the mock-inoculated WT or RDV-infected WT (non-transgenic), osein2 and J119 plants by northern blot. The blots were hybridized with radiolabeled riboprobes specific for each RNA segment. rRNAs were stained with ethidium bromide and served as loading controls. (C) Detection of RDV P2, P8, and Pns11 proteins in the mock-inoculated WT or RDV-infected WT (non-transgenic), osein2 and J119 plants by northern blot. Actin was probed and served as a loading control. (D) The incidences of infection, which were determined by visual assessment of disease symptoms at 0–8 wpi of 30 individual plants for each case. Means and standard deviations were obtained from three independent experiments.
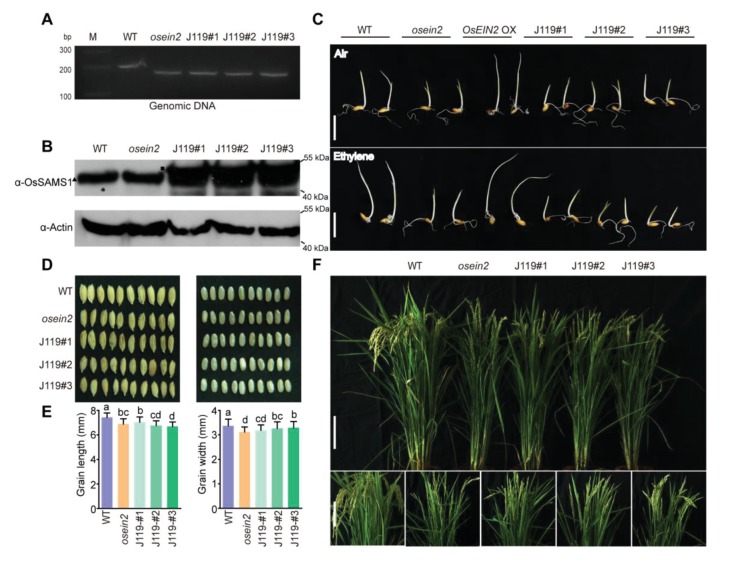
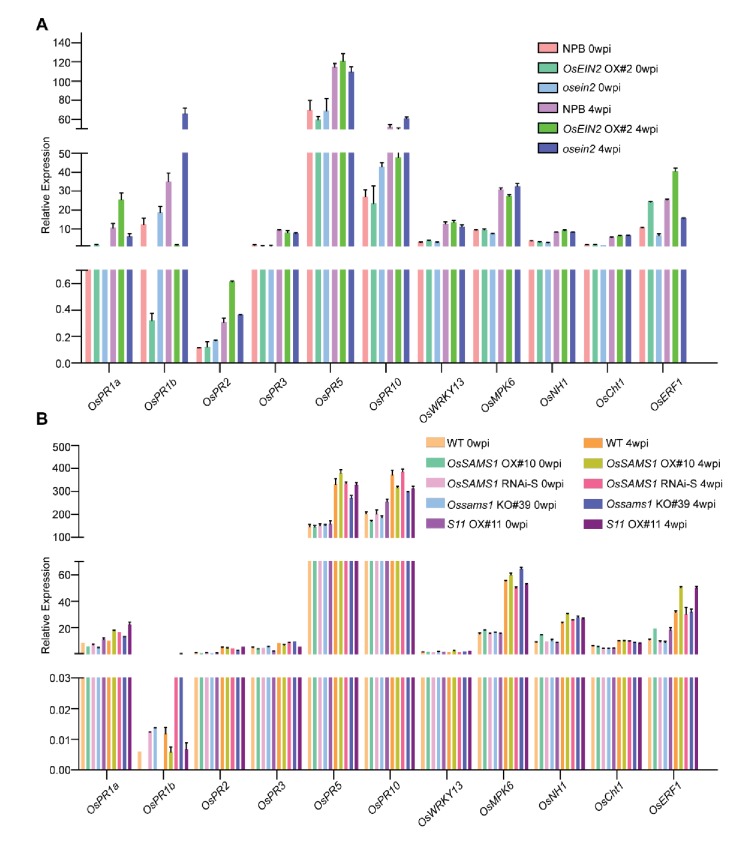
Figure 5—figure supplement 3. Detection of salicylic acid (SA)-, jasmonic acid (JA)- and ethylene-responsive genes.

Figure 5—figure supplement 3.

(A) Expression of SA-, JA- and ethylene-responsive genes over time after RDV infection in NPB, OSEIN2 OX#2 and osein2 rice lines. (B) Expression of SA-, JA- and ethylene-responsive genes over time after RDV infection in WT, OsSAMS1 OX#10, OsSAMS1 RNAi-S, Ossams1 KO#39 and S11 OX #11 rice lines.