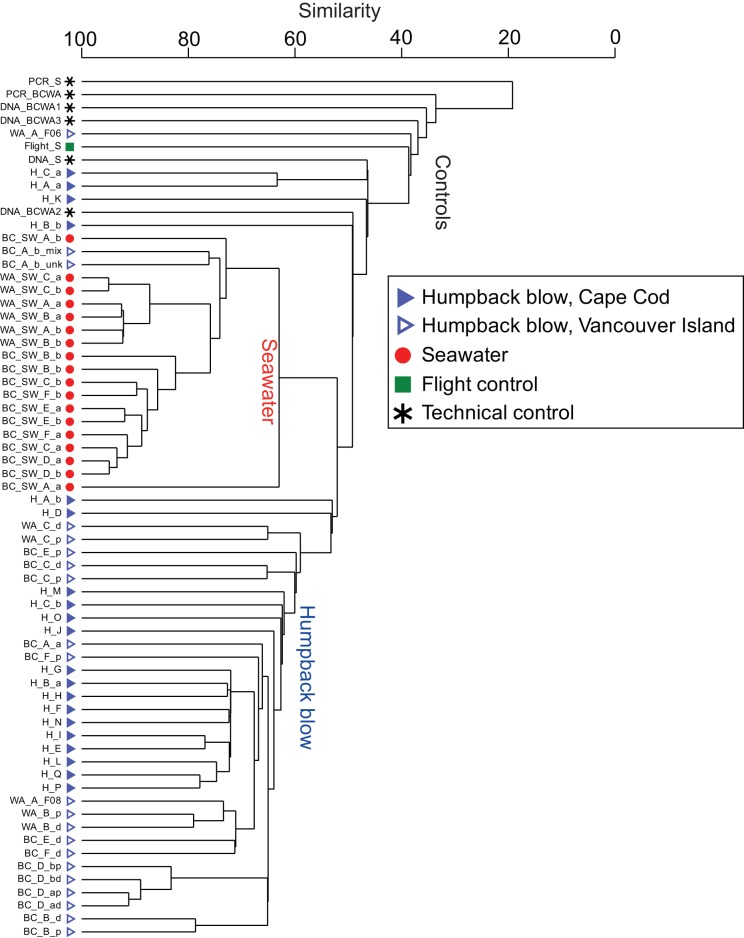
FIG 2 .
Comparison of humpback blow, surface seawater, and flight and technical control samples using a cluster dendrogram of bacterial and archaeal SSU rRNA genes grouped using minimum entropy decomposition (17) and compared using Bray-Curtis dissimilarity (18). The categories “controls,” “seawater,” and “humpback blow” were inferred based on the clustering patterns and sample types.

