
Figure 3.
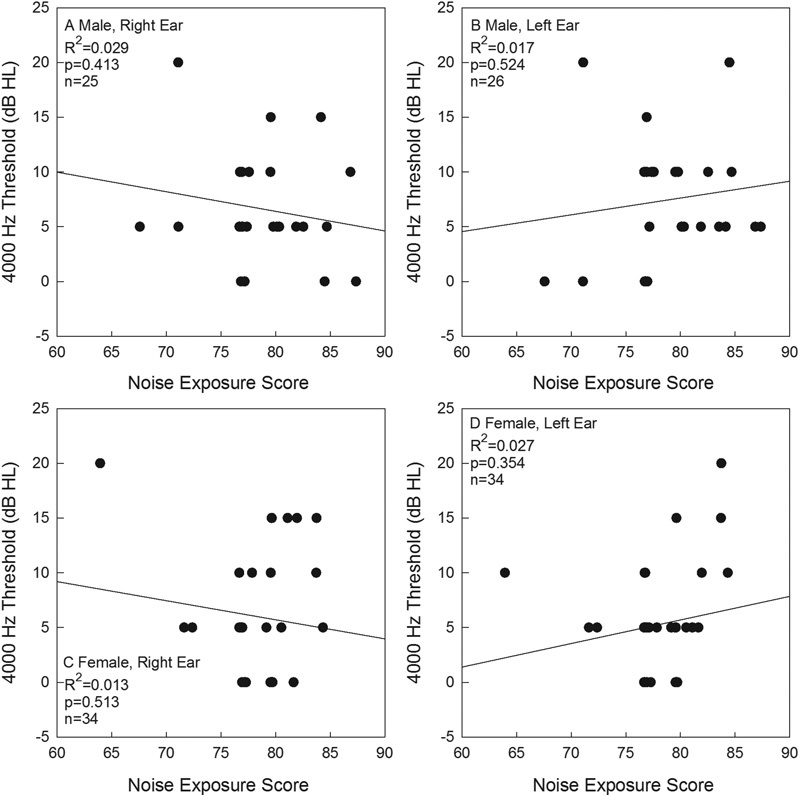
Male (A, B) and female (C, D) thresholds at 4,000 Hz shown as a function of noise exposure history. Data are shown for right ears (A, C) and left ears (B, D). HL, hearing loss.
Official websites use .gov
A
.gov website belongs to an official
government organization in the United States.
Secure .gov websites use HTTPS
A lock (
) or https:// means you've safely
connected to the .gov website. Share sensitive
information only on official, secure websites.
Male (A, B) and female (C, D) thresholds at 4,000 Hz shown as a function of noise exposure history. Data are shown for right ears (A, C) and left ears (B, D). HL, hearing loss.