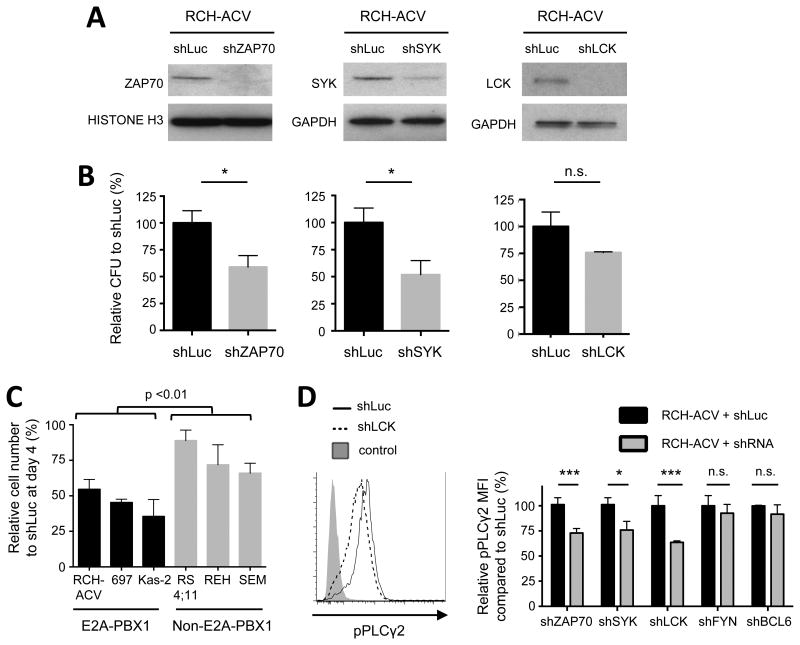
Figure 4. Oncogenic role of ZAP70, SYK and LCK in human ALL cell lines.
(A) Western blots show protein levels after shRNA-mediated knock-down of the indicated genes. GAPDH and histone H3 were used as loading controls. (B) Colonies were enumerated 14 days after FACS sorting and normalized to the number of colonies in control cells. Data represent mean ± SEM (n=4 independent experiments). CFU, colony-forming units. Statistical analysis performed by Student's t-test, * p-value <0.05, n.s., not significant. (C) E2A-PBX1 leukemia cell lines (n=3) and non-E2A-PBX1 cell lines (n=3) were depleted for ZAP70 and cells were enumerated in liquid culture using trypan blue exclusion assay 4 days after FACS sorting and compared to control transduced cells (shLuc). Data represent mean ± SEM (n=3 independent experiments). Statistical analysis between groups was performed using two-way ANOVA. (D) RCH-ACV cells were interrogated for phosphorylated PLCγ2 after shRNA-mediated knock-down of E2A-PBX1 target genes compared to control transduced cells (shLuc). mCherry positive cells (transduced cells) were gated for the analysis. Left panel, histogram from a representative experiment after LCK-depletion is shown. Right panel, data represent mean ± SEM (n=4 independent experiments). RCH-ACV cells transduced with shRNAs for FYN or BCL6 genes served as controls. MFI, median fluorescence intensity. Statistical analysis by Student's t-test, *** p-value <0.001, * p-value<0.05, n.s. not significant.

