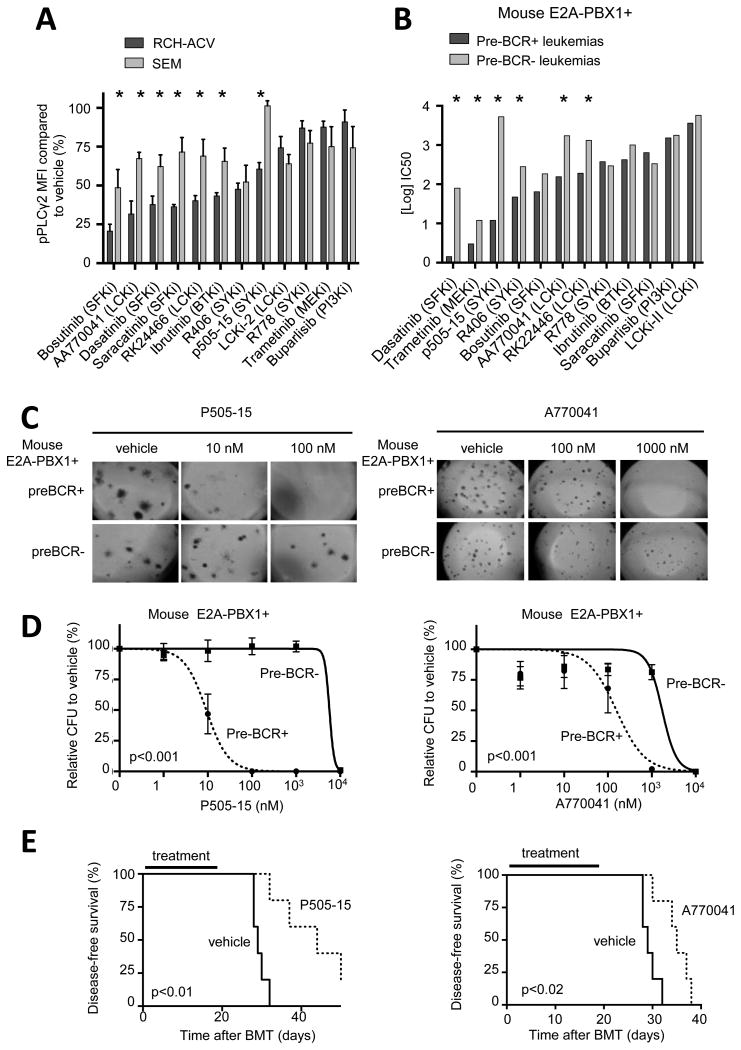
Figure 5. Pharmacological inhibition of signaling pathways upstream of PLCγ2 in E2A-PBX1 leukemias.
(A) Bars denote relative pPLCγ2 levels determined by phospho-flow after incubation of human RCH-ACV and SEM leukemia cell lines with the indicated compounds. Data represent mean ± SEM (n=3 independent experiments). Statistical analysis by Mann Whitney U test. * p-value<0.05. MFI, median fluorescence intensity. (B) Half maximal inhibitory concentration (IC50) of compounds targeting PLCγ2 upstream signaling pathways are shown for E2A-PBX1+/preBCR+ (n=3) and E2A-PBX1+/preBCR- (n=3) mouse leukemias in colony forming assays. No differences were found regarding pPLCγ2 or Zap70 status. Statistical analysis was performed using F test comparing titration curve of each compound. * p-value <0.05. (C) Images show number and morphology of colonies from preBCR+ and preBCR- mouse leukemia cells treated with p505-15 (SYKi, upper panel) and A770041 (LCKi, lower panel) (original magnification 4×). (D) Dose response curves of preBCR+ (n=3) and preBCR- (n=3) mouse leukemia cells treated with p505-15 (upper panel) and A770041 (lower panel) in colony forming assays. Statistical analysis performed by F test. (E) Kaplan-Meier curve shows disease-free survival after secondary bone marrow transplantation of mouse preBCR+ leukemia cells (n=5 in each cohort) and treatment with P505-15 (upper panel) and A770041 (lower panel), for 21 days. Statistical analysis was performed using the log-rank (Mantel-Cox) test.

