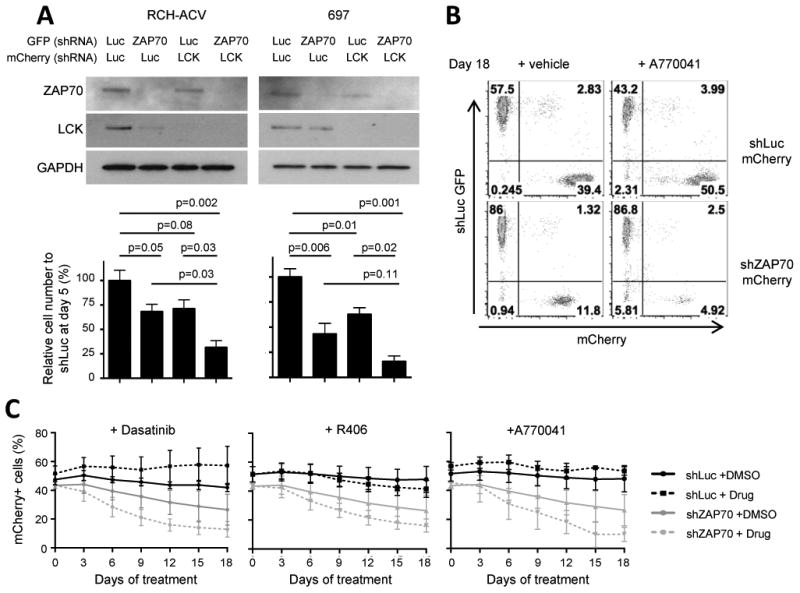
Figure 6. Genetic interactions among E2A-PBX1 target genes reveal effective combination therapies.

(A) Upper panel, western blot shows the expression of indicated proteins. GAPDH was used as loading control. Lower panel, cell concentration of shRNA transduced cells relative to control transduced cells (shLuc) 5 days after sorting. Cell numbers were quantified by trypan blue exclusion assay. Data represent mean ± SEM (n=4 independent experiments). Statistical analysis by Student's t-test. (B) Dot plots show the proportion of GFP+ and mCherry+ cells at day 18 in flow cytometry from a representative experiment in which RCH-ACV cells were transduced with shRNA for luciferase (GFP) or ZAP70 (mCherry) and mixed 50/50 at day 0. Cells were cultured in the presence of vehicle or A770041 (500 nM) for 18 days. (C) Diagrams showing % of mCherry+ cells transduced from foregoing experiment and treated with the indicated compounds for 18 days: dasatinib (20 nM), R406 (500 nM) and A770041 (500 nM). Data represent mean ± SEM (n=3 independent experiments).
