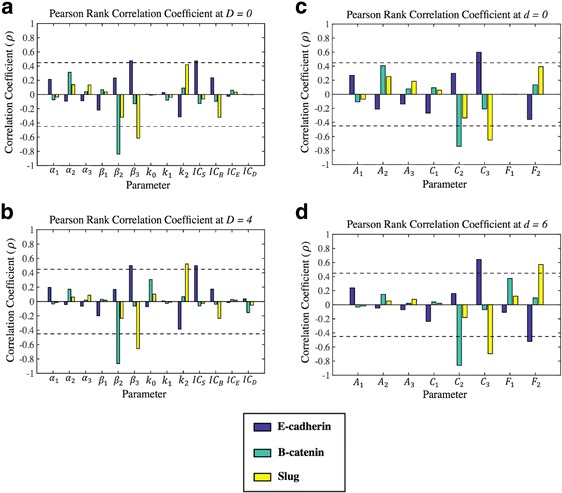
Fig. 4.

Sensitivity analysis was carried out using Latin Hypercube and Pearson’s Ranked Correlation Coefficient to understand the relationship between the steady state behavior of E-cadherin, β-catenin, and Slug and the system parameters at different levels of Dvl. The dimensional model was explored in (a and b) while the nondimensional model was explored in (c and d). A system without Wnt activation is shown in (a and c). (Fig. 4 a) Only β 2 is significantly correlated (correlation coefficient (ρ) < −0.45, p-value <0.05) with the steady state behavior of β-catenin (B), while β 3 is significantly correlated (correlation coefficient (ρ) < −0.45 or correlation coefficient (ρ) > 0.45, p-value <0.05) with the steady state behavior of E-cadherin (E) and Slug (S). Additionally, IC S is significantly correlated with the steady state behavior of E-cadherin (E). (Fig. 4b): With the activation of the Wnt pathway, the rate at which β-catenin (B) translocates to the nucleus and activates Slug (S), k 2, becomes significantly correlated with the steady state value Slug (s). (Fig. 4c) Only C 2 is significantly correlated (correlation coefficient (ρ) < −0.45, p-value <0.05) with β-catenin (b)‘s steady state behavior, while C 3 is significantly correlated (correlation coefficient (ρ) < −0.45 or correlation coefficient (ρ) > 0.45, p-value <0.05) with the steady state behavior of E-cadherin (e) and Slug (s). (Fig. 4d) With the activation of the Wnt pathway, the nondimensional rate at which β-catenin (b) translocates to the nucleus and activates Slug (s), F 2, becomes significantly correlated with the steady state values of E-cadherin (e) Slug (s). This sensitivity of E-cadherin (e) to F 2 but not k 2 in (Fig. 4b) indicates that the steady state behavior of E-cadherin may be sensitive to the ratio of the rate at which β-catenin activates Slug to the IC50 value of Slug needed to inhibit E-cadherin production
