Fig. 2.
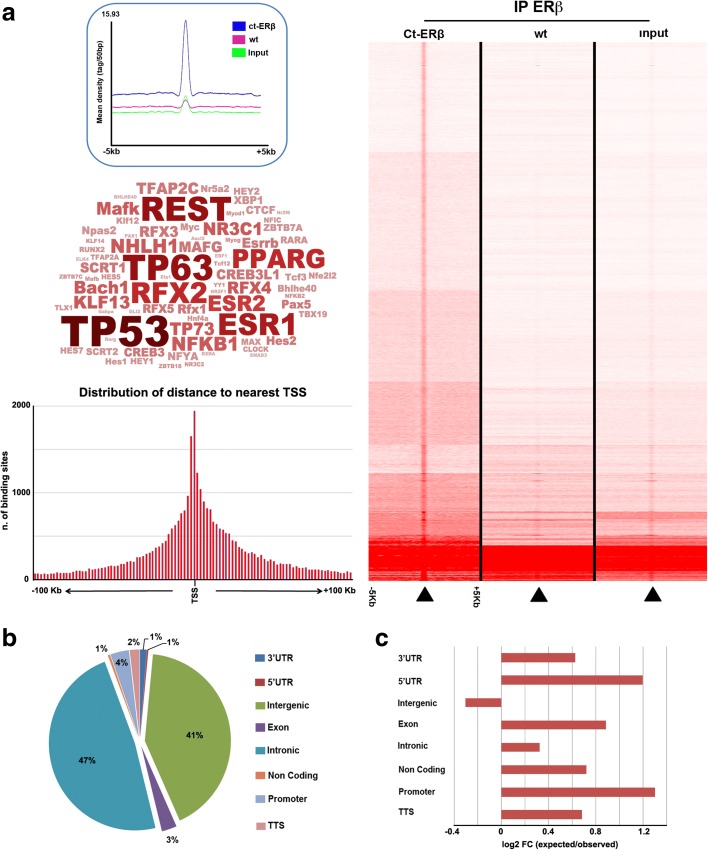
Unliganded ERβ binding site identification and annotation in BC cells. a Right panel; ERβ binding sites identified by ChIP-Seq in the Ct-ERβ cell genome. The heatmap shows read density in the 10-kb regions centered on each binding site in Ct-ERβ cells (left), wild-type (wt; ERβ−) MCF-7 cells (center) and input DNA (right). Left panel: mean read densities within and around ERβ binding sites (top), transcription factor binding motifs most enriched within ERβ sites (center), and distribution of annotated ERβ binding sites respect to the nearest transcription start site (bottom). b ERβ binding site distribution in the genome. c Observed vs expected distribution of ERβ binding sites within gene segments, calculated according to Genome Analyzer Tester

