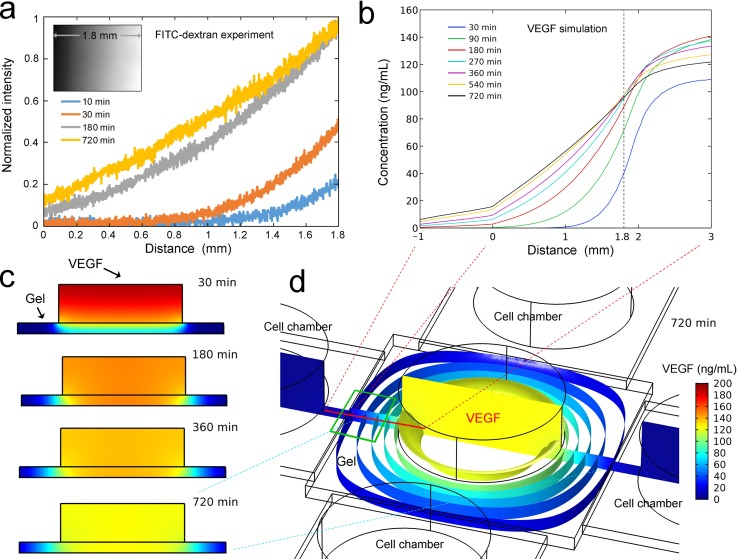
FIG. 3.
Diffusion of FITC-dextran and VEGF in the gel scaffold. (a) Diffusion of FITC-dextran in the collagen scaffold. The inset shows a grayscale representation of FITC-dextran diffusion in the gel scaffold. (b) Simulation of VEGF diffusion in the device. The position from which these data were derived is shown by the red line in (d). (c) The vertical sections showing VEGF diffusion. The position of these sections is shown by the vertical section in (d). (d) The isosurfaces and vertical section of VEGF diffusion at 720 min. The main observation region of EC sprouting is shown by the green wireframe.

