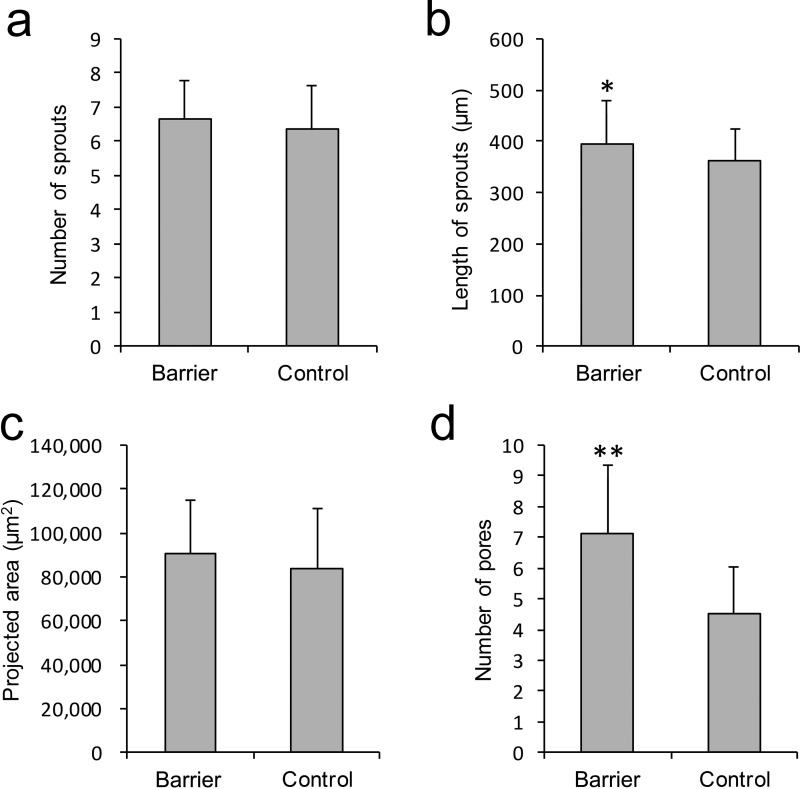
FIG. 6.
Quantitative assays of HUVEC sprouting. (a) The number of sprouts. (b) The length of sprouts. (c) The projected area of the sprouting region. (d) The number of pores formed by interconnecting sprouts. These results are based on the fluorescence data in a 500-μm-long statistical region (*P < 0.05, **P < 0.001; Student's t-test, n = 5 devices; error bars are presented as ±SD).

