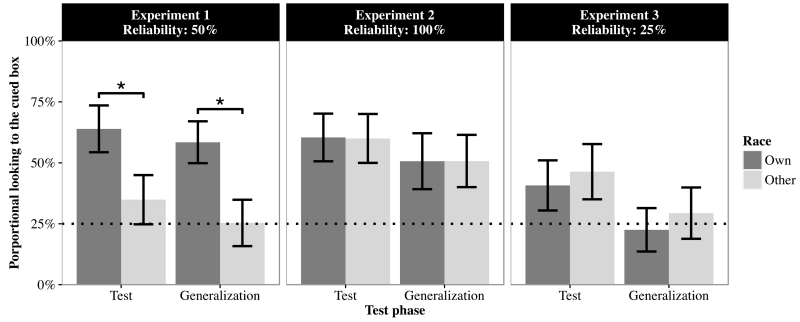
Figure 3.
Mean proportional looking times for the cued boxes on test and generalization trials where the own- and other-race adults were 50% (Experiment 1: left panel), 100% (Experiment 2: central panel), and 25% reliable (Experiment 3: right panel). The dashed line indicates chance-level looking percentage. Asterisks indicate significant differences in infant gaze following between the own- and other-race conditions. Error bars indicate one standard error.

