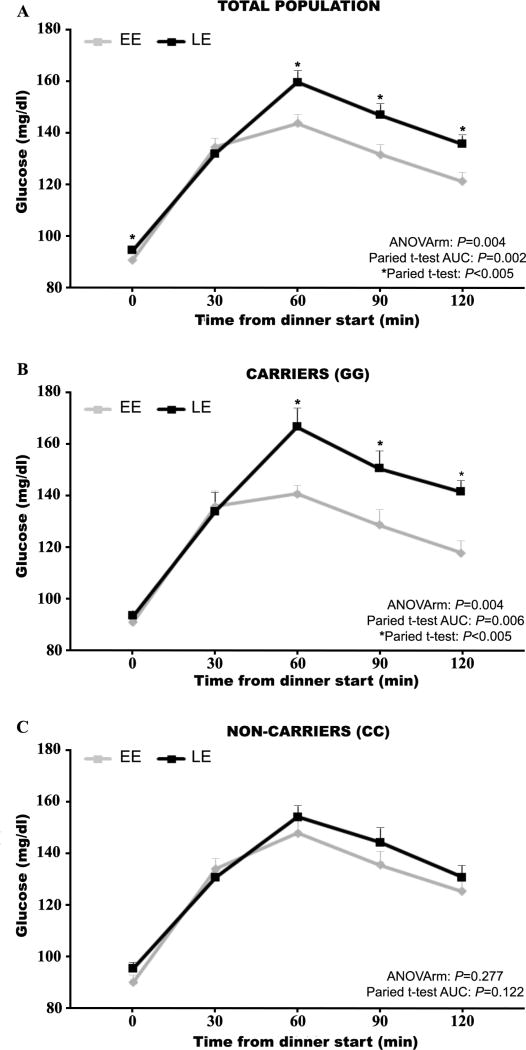
Figure 2. Glucose tolerance curve for total population and risk carriers and non-carriers of the MTNR1B gene.
Each curve represents the glucose concentrations just before dinner (T0) and 30, 60, 90 and 120 minutes after dinner. The black line is for the late diner condition (LE) and the gray line is for the early dinner condition (EE). Glucose profiles for the total population are represented in the panel 1A, while glucose profiles for the two MTNR1B genotypes, risk carriers (GG) and non-carriers (CC), are represented in the panels 2B and 2C, respectively.

