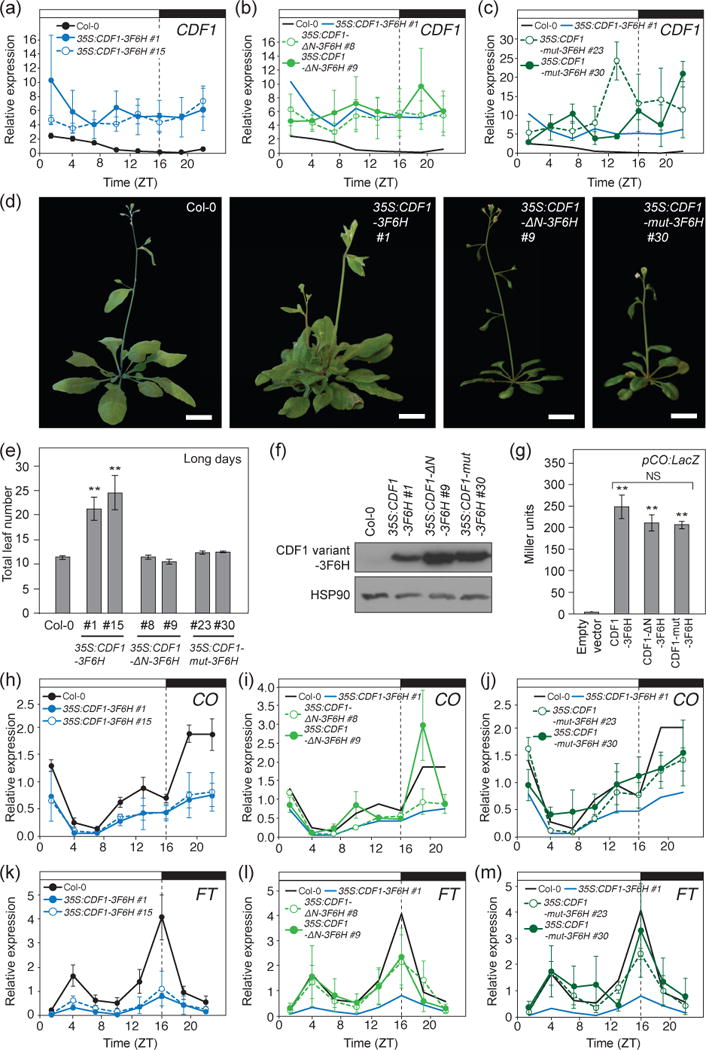
Figure 2. Removal of TPL interacting residues attenuates CDF1 repressor function.

(a, b, and c) CDF1 expression levels in Col-0, 35S:CDF1-3F6H (a), 35S:CDF1-ΔN-3F6H (b), and 35S:CDF1-mut-3F6H plants (c) grown in long days for 14 days. Means +/− SEM were calculated from four independent experiments. The traces of diurnal CDF1 expression changes in Col-0 and 35S:CDF1-3F6H #1 shown in (a) are included in (b) and (c) for comparison. (d) Representative images of WT, 35S:CDF1-3F6H, 35S:CDF1-ΔN-3F6H, and 35S:CDF1-mut-3F6H plants at flowering in long days. Scale bars=2 cm. (e) Quantification of flowering time by total leaf number at bolting from (d) under long days. Means +/- SEM were calculated from N=16 individuals. **P < 0.01 (one-tailed t test). (f) CDF1-3F6H, CDF1-ΔN-3F6H, and CDF1-mut-3F6H protein expression at ZT4 time point in 14-day-old long-day grown transgenic seedlings. HSP90 served as a loading control. (g) Y1H analysis of CDF1-3F6H, CDF1-ΔN-3F6H, CDF1-mut-3F6H proteins binding to a 500 bp region of the CO promoter (pCO:LacZ), which contains a previously characterized DOF binding cis-element repeats. LacZ activity is displayed in Miller units. Means +/− SEM were calculated from three independent experiments. **P < 0.01 (one-tailed t test), NS = non-significant. (h, i, and j) Gene expression analysis of CO in Col-0, 35S:CDF1-3F6H (h), 35S:CDF1-ΔN-3F6H (i), and 35S:CDF1-mut-3F6H plants (j). Plants were grown in long days for 14 days. Experiments were repeated four times independently, and the means +/- SEM derived from four experiments are shown. The traces of diurnal CO expression changes in Col-0 and 35S:CDF1-3F6H #1 shown in (h) are included in (i) and (j) for comparison. (k, l, and m) Gene expression analysis of FT in Col-0, 35S:CDF1-3F6H (k), 35S:CDF1-ΔN-3F6H (l), and 35S:CDF1-mut-3F6H plants (m). Plants were grown in long days for 14 days. Experiments were repeated four times independently, and the means +/− SEM derived from four experiments are shown. The traces of diurnal FT expression changes in Col-0 and 35S:CDF1-3F6H #1 shown in (h) are included in (i) and (j) for comparison.
