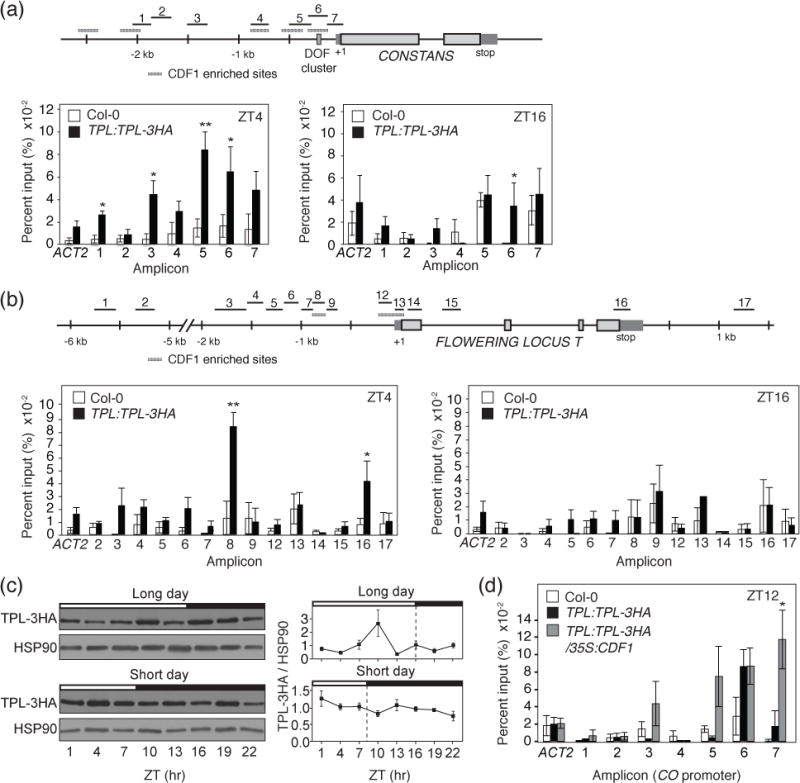
Figure 3. TPL associates with the CO and FT promoter regions during the morning in a CDF1-dependent manner in vivo.

(a and b) ChIP assay-showing TPL binding to regions of the CO and FT genomic locus at ZT4 and ZT16 from 14-day-old TPL:TLP-3HA and Col-0 plants grown under long-day photoperiods. The schematic diagrams of positions of each ChIP amplicon scattered in CO and FT promoter regions are shown. The results are means and +/− SEM calculated from four independent experiments. Col-0 plants were used as negative controls. *P < 0.05,**P < 0.01 (one-tailed t test). Hatched grey boxes indicate regions of CDF1 enrichment from Sawa et al., 2007 and Song et al., 2012, respectively. (c) Daily protein expression profiles of TPL in long days and short days. 14-day-old TPL:TLP-3HA plants were used for experiments. Experiments were performed three times independently. Means +/− SEM were calculated from ratios of signal strength of TPL proteins and HSP90 loading control. (d) ChIP experiment for TPL binding to the CO genomic locus at ZT12, in Col-0, TPL:TPL:3HA, and 35S:CDF1 TPL:TPL:3HA plants. All calculations were performed as in (a) and (b). Plants were 14 days old and grown under long-day photoperiods.
