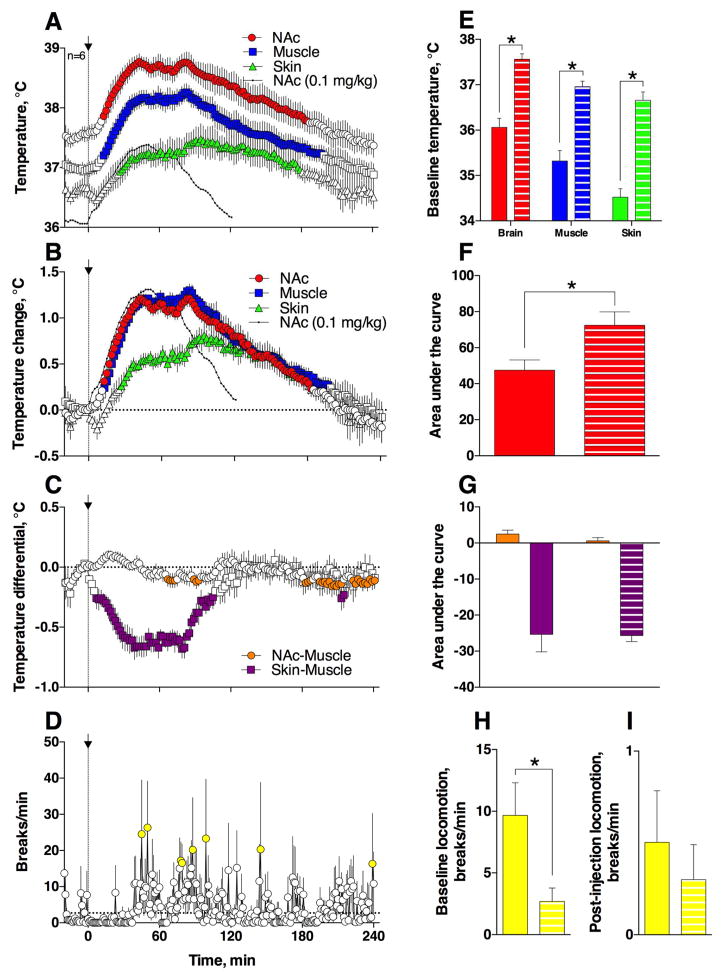
Figure 3. Temperature and locomotor responses induced by iv heroin (0.1 mg/kg) administered at 29°C ambient temperatures.
Left panel (A–D) shows the time-course of changes in temperatures and locomotion. Filled symbols show values significantly different from baseline (at least p<0.05, Fisher test). Data are shown as mean (±sem) with 2-min time resolution. Right panel (E–I) shows between-group (22 vs. 29°C) differences in basal values of temperature and locomotion and their changes induced by heroin. Solid bars indicate the 22°C group, and striped bars indicate the 29°C group. Asterisks show significant differences between groups indicated (p<0.05; Fisher test). Black curves in A and B show absolute (A) and relative (B) changes in NAc temperature induced by heroin at 22°C.

