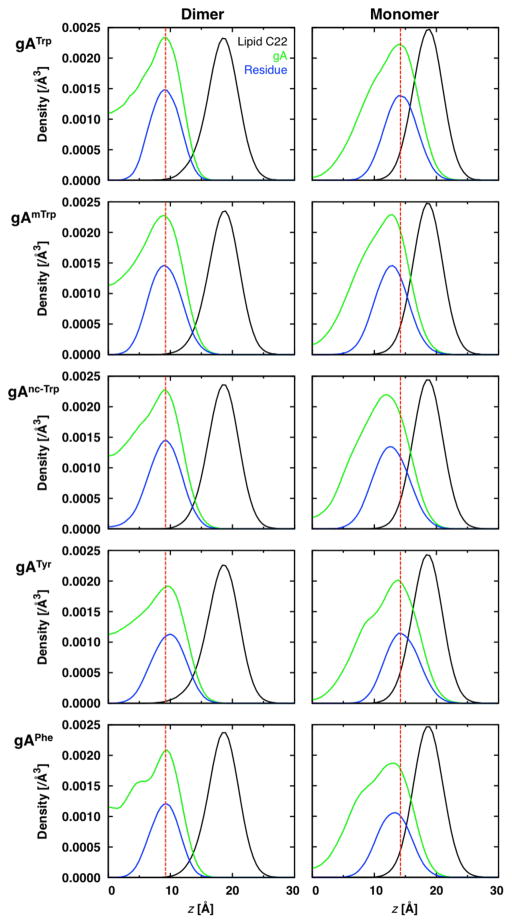
Figure 7.
Heavy-atom z-density plots for the lipid C22 atom (black), entire channel (green), and the channel’s interfacial residues (blue) in dC22:1. Dotted red lines are shown to accentuate the entire channel peak shifts relative to gATrp. Data is plotted in 0.5 Å bins. Systems were centered by shifting the bilayer’s center of mass to z = 0 Å.

