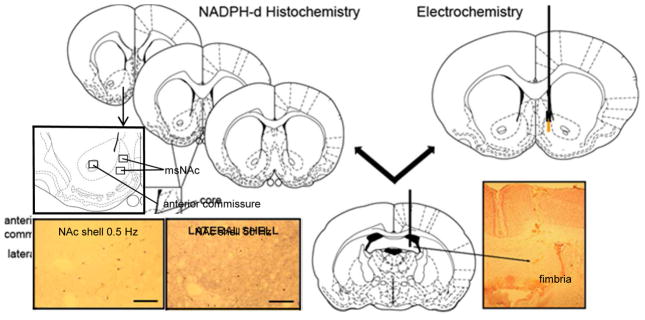
Figure 1. Techniques used to measure NOS activity in the msNAc.
Left) The optical density of the region of interest (boxed area) in the right and left hemispheres of each of the three representative coronal sections was measured. The anterior commissure was used as a comparison area for the generation of measures of non-specific staining. Optical Density values measured in the msNAc subregions were subtracted from those measured in the anterior commissure to give a relative optical density value. Insets: photomicrographs demonstrating NADPH-d staining in the msNAc following 0.5 Hz (left) and 50 Hz (right) electrical stimulation of the fimbria. Right) Position of NO microsensor and stimulating electrode implants in the msNAc and hippocampal fimbria, respectively. Inset: photomicrograph demonstrating the target region of stimulation electrode in the hippocampal fimbria. Arrowhead demonstrates the site of termination of the electrode track. Diagrams are derived from the atlas of Paxinos and Watson, 1986.

