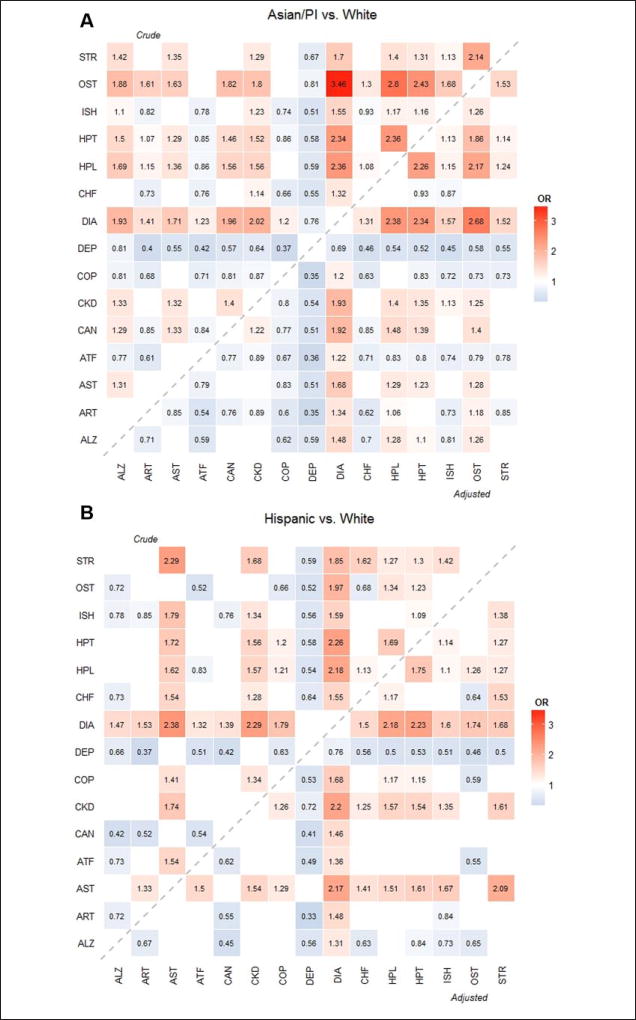
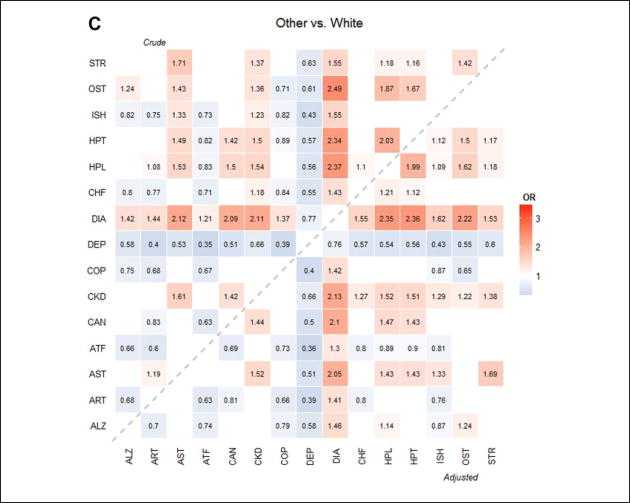
Figure 1.
Heat map of the OR of dyads by race/ethnicity.
Note. ORs were used to compare Asians/PIs, Hispanics, and Others to Whites. Crude ORs were obtained from logistic regressions adjusting for race/ethnicity only. Adjusted ORs were obtained from multivariable logistic regressions adjusting for race/ethnicity, age, gender, residential area, and dual eligibility status. The upper triangular region shows crude ORs and lower triangular region shows adjusted ORs compared with Whites. Hotter (reddish) color indicates larger OR (greater than 1; that is, prevalence rate of the race/ethnicity is higher than Whites) and colder (bluish) color indicates lower OR (less than 1; that is, the prevalence or mortality rate of the race/ethnicity rate is lower than Whites). Insignificant ORs were not presented in the figures. OR = odds ratio; PI = Pacific Islander; ALZ = Alzheimer’s disease or dementia; ART = arthritis; AST = Asthma; ATF = atrial fibrillation; CAN = cancer; CKD = chronic kidney disease; COP = chronic obstructive pulmonary disease; DEP = depression; DIA = diabetes; CHF = heart failure; HPL = hyperlipidemia; HPT = hypertension; ISH = ischemic heart disease; OST = osteoporosis; STR = stroke.


