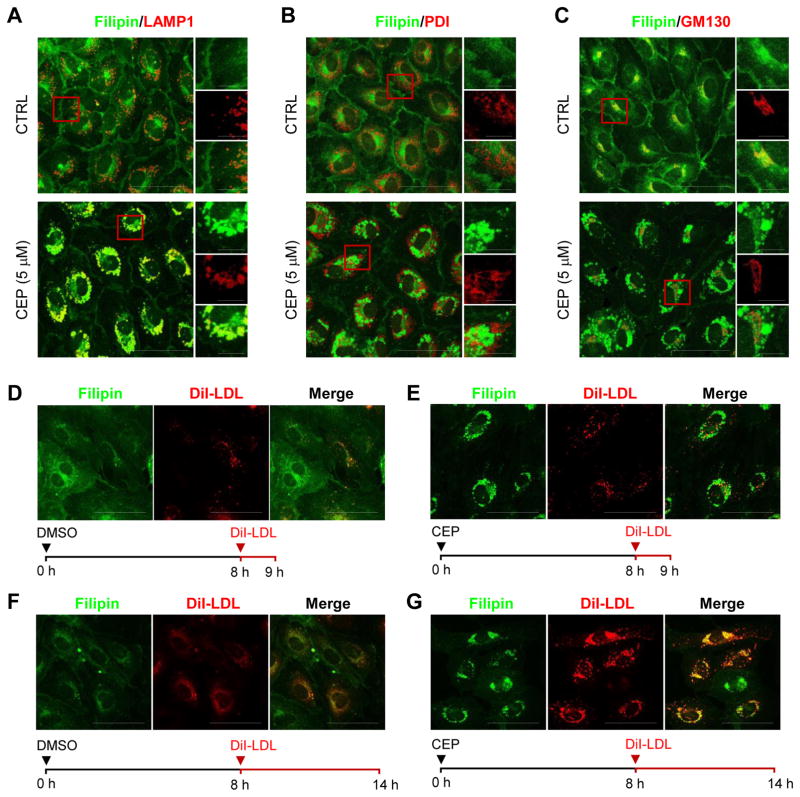
Figure 2.
Effect of CEP on free cholesterol and LDL trafficking in endothelial cells. (A–C) HUVEC were treated with CEP (5 μM) or DMSO (CTRL or control) for 14 h and observed under a confocal microscope after immunostaining with filipin, LAMP1, a late endolysosome marker (A), PDI, an endoplasmic reticulum (ER) marker (B), and GM130, a Golgi marker (C). Scale bar = 50 μm. Images in the inlets (red square) were magnified and shown on the right side of each figure. Filipin is shown as green and each organelle marker is shown as red color. The bottom images are merged color images. Scale bar for the inlets = 10 μm. (D–G) HUVEC were treated with CEP (5 μM) or DMSO for 8 h and then the cells were incubated with DiI-LDL for additional 1 h (D and E) or 6 h (F and G), as indicated with the time frame shown at the bottom of each figure. Filipin is shown as green and DiI-LDL is shown as red color. Scale bar = 50 μm.

