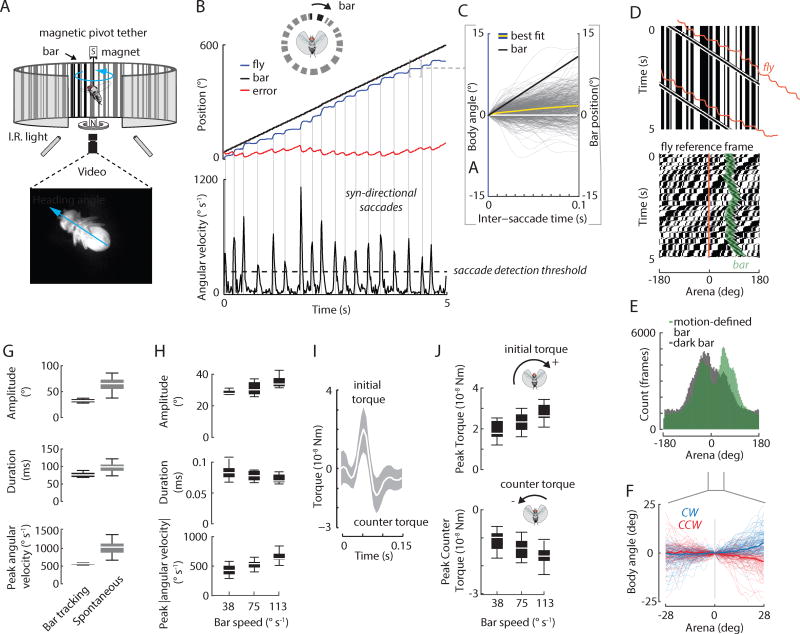
Figure 1. Flies generate bar-fixation saccades that are different than spontaneous saccades and dynamically tuned to bar motion.
A) Arena to study visual fixation of bar with the fly free to rotate in yaw. The fly is suspended within a magnetic field and illuminated from below with infrared lights. A bar of random “on” and “off” pixel columns is superimposed over a similarly randomly-generated background. B) Top panel: fly heading (blue), relative bar position (black), and error angle (red) between the fly and the bar during bar fixation. Bottom panel: filtered velocity data. Horizontal dashed line: threshold for detecting saccades. Vertical lines: identified saccades. C) Body angle (blue) and bar reference angle (black) between saccades during bar fixation. The yellow line is the best-fit line through the body angle data. D) Top: space-time graph of bout shown in B. Each pixel row represents the azimuthal distribution of “on” and “off” pixels displayed in the arena at a point in time. Slanted lines indicate clockwise bar rotation over time. Vertical lines indicate the stationary background over time. The fly trajectory is shown in orange. Bottom: space-time graph of bout shown in B, but in fly’s visual reference frame (orange). The bar is highlighted in green shading for visual comparison. E) Histogram of bar position in fly reference frame for motion-defined and traditional dark bar stimuli, indicated with cartoons. Bar rotation velocity = ±75°s−1. n = 12 animals with balanced experimental design. 112 trials (56 motion-defined bar, 56 dark bar). We analyzed CW and CCW data together and show the distribution of signed bar position with respect to the fly visual midline. F) Trajectory of body angle for instances in which the motion-defined bar passed across visual midline between saccades for clockwise (CW) and counter-clockwise (CCW) bar rotation. Thin lines are from individual flight trajectories, thick lines are means. To emphasize the contribution of smooth movement, fly trajectories are plotted within a narrow spatial window where saccades are less frequently generated (see Figure 2A). G) Box plot of saccade amplitude, duration, and angular velocity for bar fixation (black) and spontaneous (grey) saccades. The dynamics of bar-fixation saccades were statistically different from spontaneous saccades. Bar-fixation saccades: 2,968 saccades from 10 animals. Spontaneous saccades: 4,137 saccades from 23 animals. H) Body saccade dynamics are tuned to the bar velocity. Bar velocity had a significant effect on saccade duration, amplitude, and peak angular velocity (ANOVA, P < 0.001 for all). I) Flies generate an initial torque followed by a counter torque. The white line shows the mean torque. Shaded areas are ± 1 STD. J) Initial peak torques are tuned to the bar speed (p < 0.001). Peak (minimum) counter-torques scale with bar speed (p < 0.001). Except for E), n = 2,968 saccades from 10 animals. See also Figure S1 and Movie S1.

