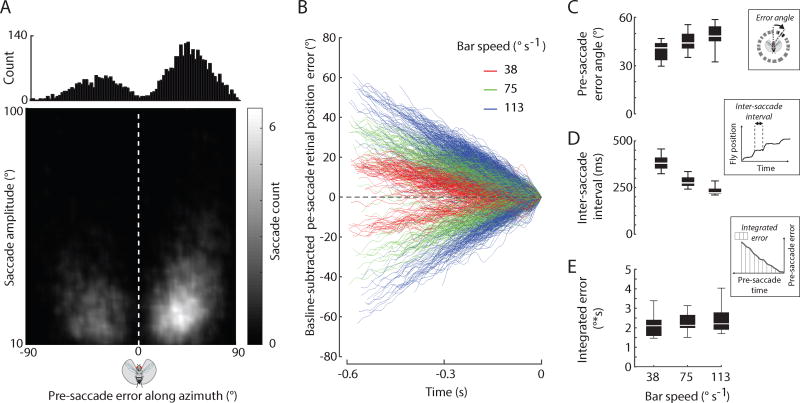
Figure 2. Bar-fixation saccades are triggered by a time integral of bar position error.
A) The distribution centers of saccade-triggered error angles along the visual azimuth during bouts of visual fixation. Error angles between the flies’ heading and the bar position were offset by approximately ± 45°. Shaded bar indicates the number of saccades. Error is computed between visual midline and bar center. Bar width = 30°. B) The error angle between the bar and fly’s heading are baseline-subtracted and plotted in time prior to a saccade. The positive and negative pre-saccade errors correspond to CW and CCW stimuli, respectively. C) The magnitude of the saccade-triggering error is dependent on the speed of the bar (p < 0.001). D) The inter-saccade intervals (ISI) scale inversely with the speed of the bar (p < 0.001). E) The integrated error between saccades changed little as the speed increased (p=0.261). Insets for C–E (dotted lines) show how each quantity was evaluated. n = 2,698 saccades from 10 animals. See also Figure S2.

