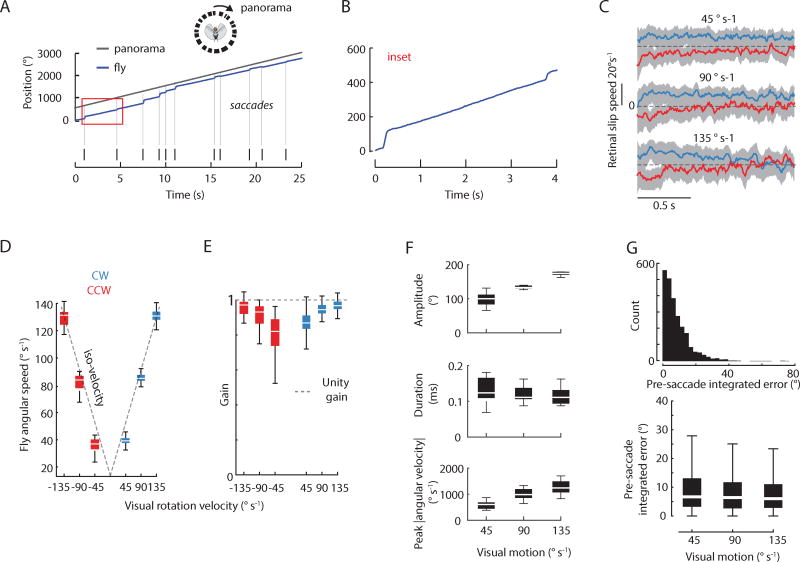
Figure 3. Optomotor saccades are triggered by a threshold in the fixed time integral of velocity.
A) Example 25-second trial of fly tracking the motion of a rotating visual landscape at 90°s−1. Vertical lines represent individual saccades. For visual clarity, the panorama position is offset from 0 deg. B) Inset expanded from red box in panel A to show smooth optomotor movement. C) Mean retinal slip, in units of velocity, during the average 1.5 s interval of smooth movement between saccades across three different rotation speeds for CW (blue) and CCW (red) rotation across all animals. Gray area: SEM. D) Box plot of fly angular velocity with respect to motion of the visual landscape. Gray dashed line: slope of 1 where visual rotation velocity is equal to fly angular speed. E) Same data as panel D but for optomotor gain (fly speed divided by visual rotation speed) across visual rotation velocities. Gray dashed line = unity gain. F) Saccade dynamics across three speeds of panorama motion. Speed had a significant effect on dynamics (p < 0.001 for all). G) Top: Distribution of pre-saccade integrated error for all speeds pooled. Bottom: Pre-saccade integrated error is speed invariant. For all panels: 2,232 saccades during optomotor response for CW and CCW rotation, n = 10 flies, 451 trials. See also Figure S3 and and Movie S2.

