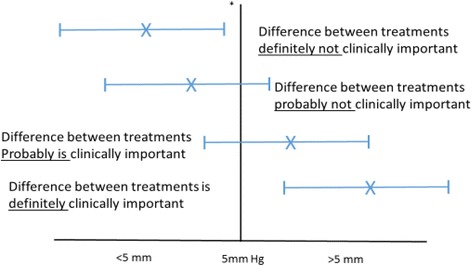
Fig. 4.

Mean clinical difference between two treatments (mean systolic blood pressure (BP)).  point estimate of the difference between groups,
  95% confidence intervals, *minimum clinically important difference (MCID)

Mean clinical difference between two treatments (mean systolic blood pressure (BP)).  point estimate of the difference between groups,
  95% confidence intervals, *minimum clinically important difference (MCID)