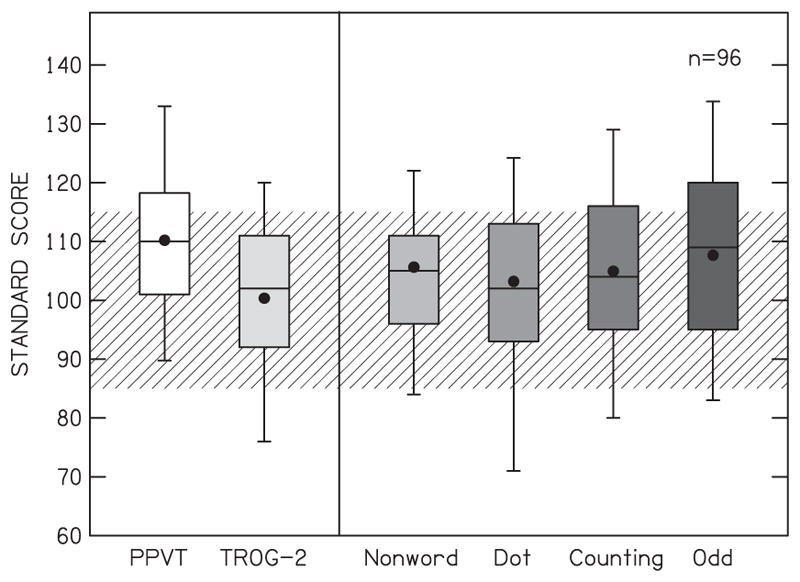
Figure 1.

Box plots of the standard scores for language and cognitive measures for children who participated in the study. The boxes represent the interquartile range (25th–75th percentiles) and the whiskers represent the range of the 5th and 95th percentiles. The horizontal lines within each bar represent the medians and the filled circles represent the mean. The hatched area represents 1 standard deviation from the normative mean for each measure. PPVT =Peabody Picture Vocabulary Test; TROG =Test of Reception of Grammar; Nonword =Automated Working Memory Assessment (AWMA) Nonword Recall Subtest; Dot =AWMA Dot Matrix Subtest; Counting =AWMA Counting Recall Subtest; Odd =AWMA Odd-one-out subtest.
