Fig. 1.

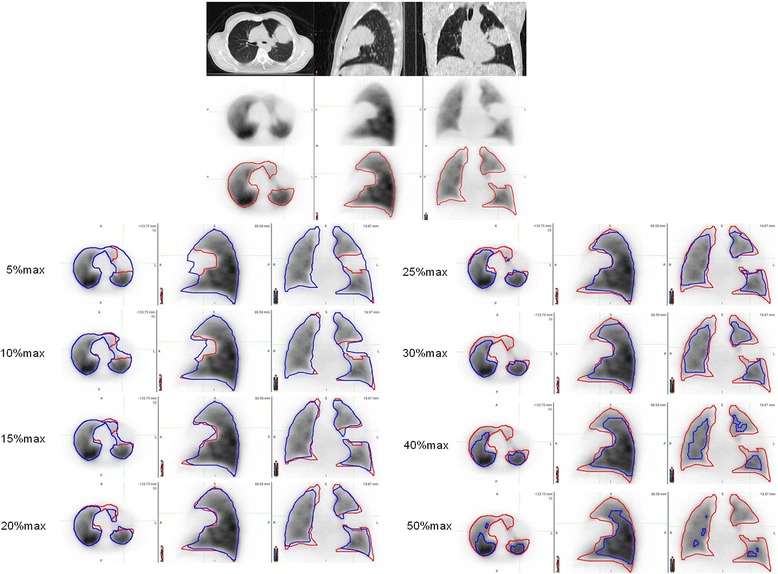
Example of functional perfusion volume delineation. Visually defined manual contour is displayed in red. Automatic contours obtained by applying a cutoff value expressed as a percentage of the maximal value are displayed in blue

Example of functional perfusion volume delineation. Visually defined manual contour is displayed in red. Automatic contours obtained by applying a cutoff value expressed as a percentage of the maximal value are displayed in blue