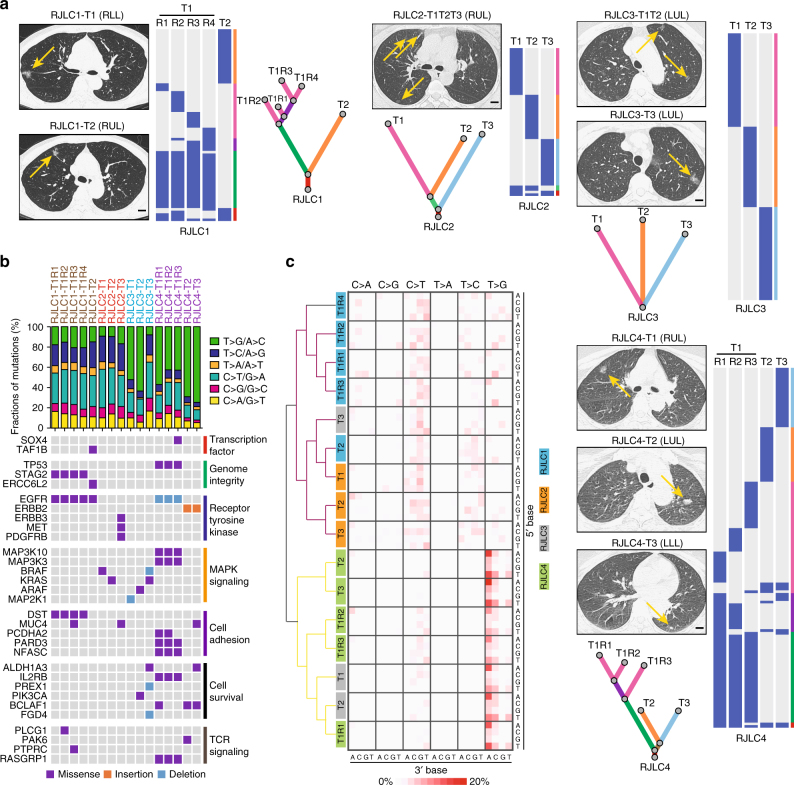
Fig. 1.
Clonal architecture and mutational landscape of MSLC. a Computed tomography (CT) diagnosis and clonal architecture of multifocal tumors in four MSLC patients. Heat maps showed the presence (blue) or absence (gray) of all non-silent somatic mutations in every tumor region. Phylogenetic trees indicated the clonal structure of sequenced tumor regions in each patient. Scale bar, 1 cm. b Mutational landscape of all 16 sequenced tumor regions. Putative driver genes with somatic mutations were classified according to the functional categories. c Frequencies for each of the six substitutions at all 16 possible trinucleotide contexts were displayed in a heat map. All specimens were separated into two major clusters based on the mutational signatures

