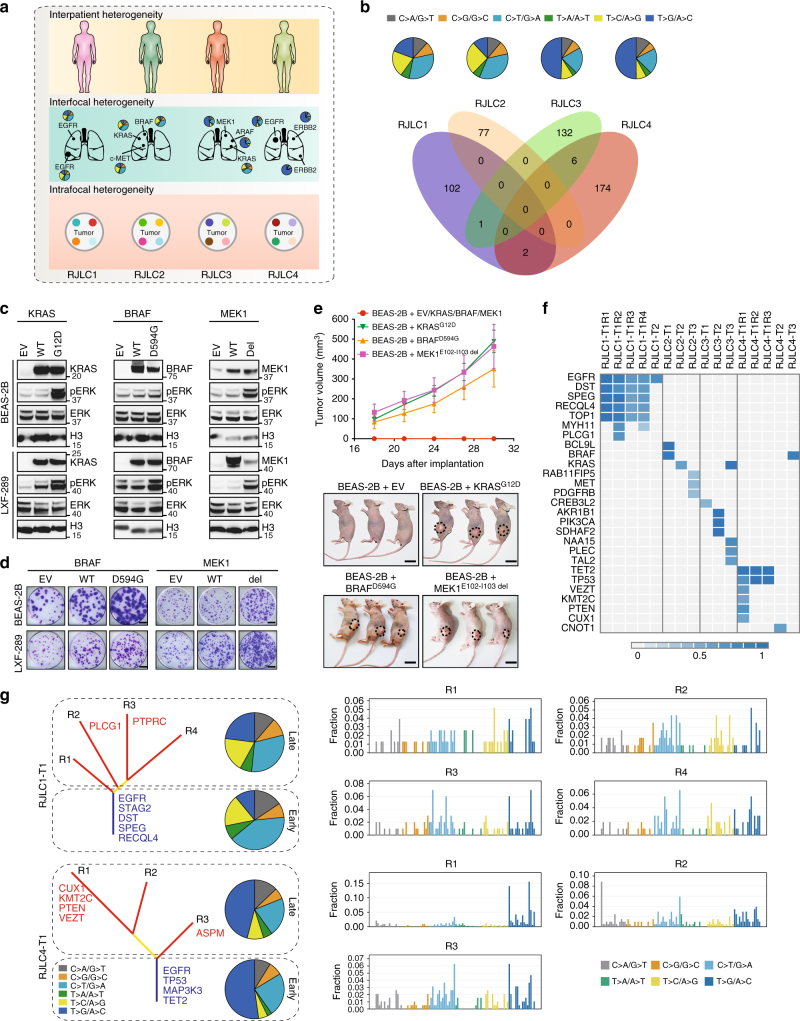
Fig. 2.
Interfocal and intrafocal genetic heterogeneity of MSLC. a A schematic overview of tumor heterogeneity analysis at interpatient, interfocal and intrafocal levels. b Mutation spectra of four MSLC patients were summarized by pie charts and shared mutations between different subjects were showed in Venn diagram. c Overexpression of indicated wild-type or mutant genes in BEAS-2B or LXF-289 cells. Gene expression and ERK phosphorylation were measured by immunoblotting. d Indicated wild-type or mutant genes were lentivirally introduced into BEAS-2B or LXF-289 cells. Cells were cultured for two weeks and stained with crystal violet. Scale bar, 5 mm. e Tumor growth of BEAS-2B xenografts that ectopically expressed indicated mutant genes. Each line represented mean tumor volume of the respective group, and error bars indicated standard deviation (10 mice per group). Scale bar, 10 mm. f A heat map presented the CCF of putative driver mutations in each sequenced region of the MSLC tumors. g Mutation spectra of early mutations (trunk) and late mutations (branch), and mutational signatures of different tumor regions in M-seq samples of RJLC1-T1 and RJLC4-T1

