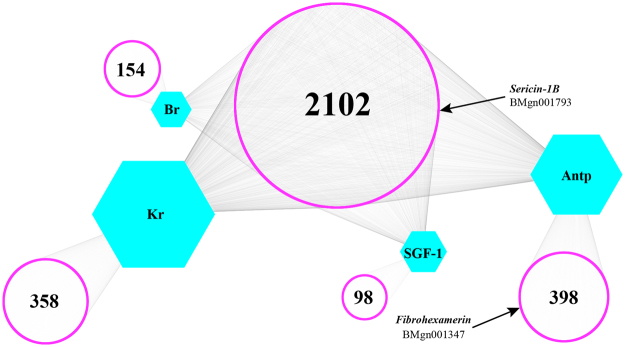
Figure 3.
Network graphic for four transcription factors (TFs) and their adjacent genes. Hexagons represent known motifs. The points that form the purple circles represent genes regulated by the corresponding TF. Lines are used to indicate genes that might be regulated by the corresponding TFs. Genes located within the big circle located in the middle might be regulated by two or more TFs. Genes within the peripheral small circle might be regulated by only one TF.

