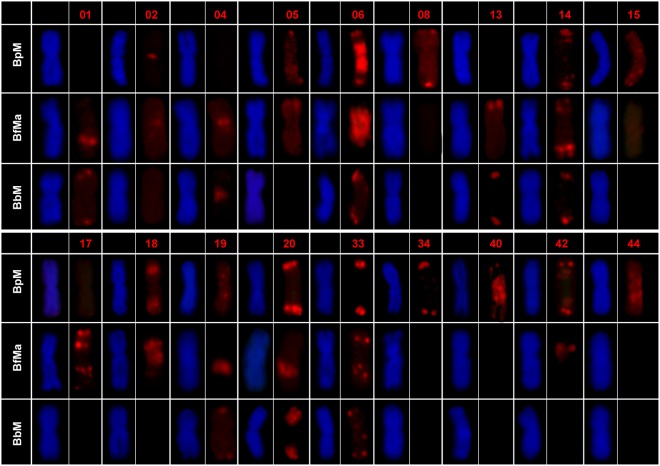
Figure 5.
Distribution of satDNAs on the B chromosomes of A. paranae (BpM), A. fasciatus (BfMa) and A. bockmanni (BbM). The red numbers indicate catalog number for each satDNA. DAPI-stained chromosomes and satDNA hybridization patterns are displayed side-by-side for each B-variant. Note that all satDNAs showing signals on BpM and BbM chromosomes show symmetric distribution, whereas only five of them are symmetric in the BfMa chromosome.

