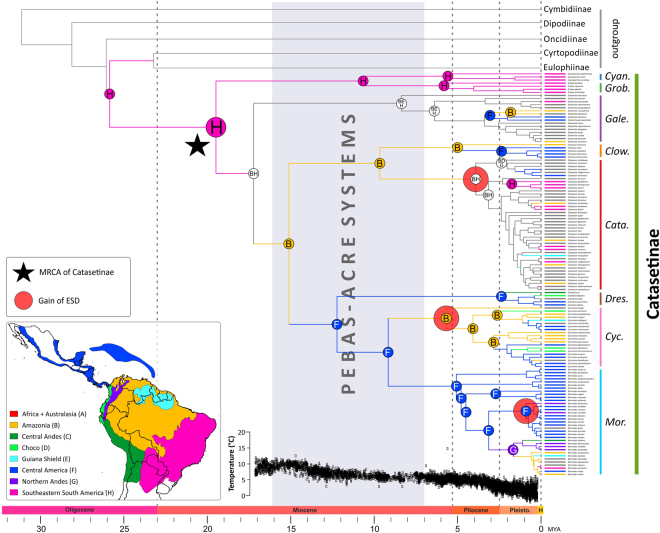
Figure 2.
Chronogram of Catasetinae and sister subtribes obtained under a relaxed clock model, applied to a non-conflicting, concatenated nuclear and plastid loci. Minimum and maximum age intervals are provided in Fig. S4. Time scale is provided in million years (Mya). Node charts correspond to ancestral areas estimated under the BAYAREA + J model. The most recent common ancestor (MRCA) of Catasetinae is indicated with a black star, and gains of ESD are indicated with red circles. Coded biogeographical areas are colour-coded following inset map, and are shown in front of taxa names (grey colours indicate taxa distributed in more than one biogeographical region). Catasetinae genera are colour coded as in Fig. 1 (Mor.: Mormodes; Cyc.: Cycnoches; Dres.: Dressleria; Cata.: Catasetum; Clow.: Clowesia; Gale.: Galeandra; Grob.: Grobya; Cyan.: Cyanaeorchis). The approximate time span of Pebas and Acre mega-wetlands36 is indicated by a grey rectangle. Inset: Coded areas used for biogeographical analysis. Geopolitical boundaries map generated by ArcMAP (http://www.sri.com) using political divisions and elevation data from DIVA-GIS (http:www.diva-gis.org/data). Climate curve of the last 17 Myr represented as a function of oxygen-isotope records61.

