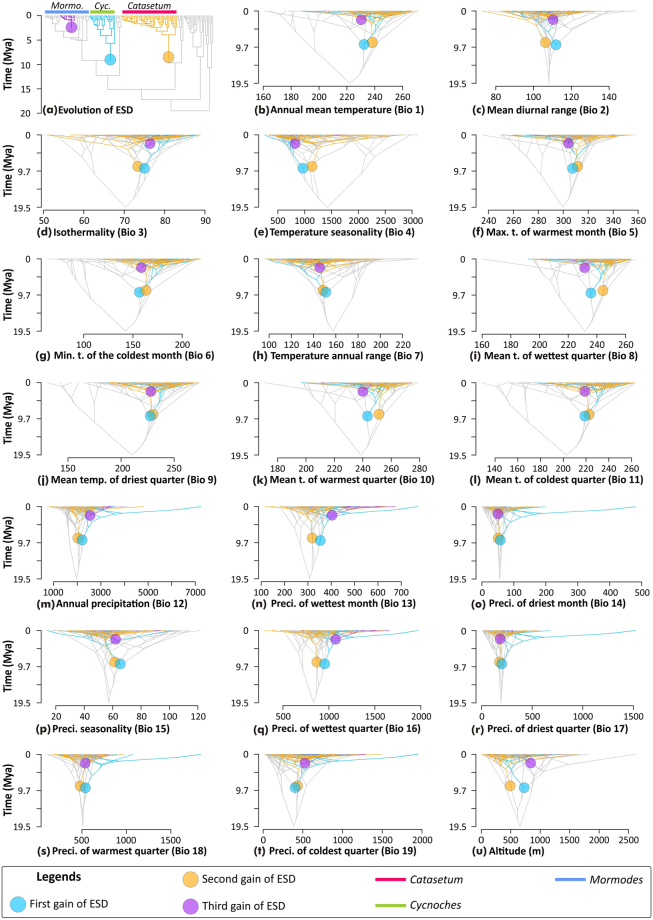
Figure 3.
Evolution of ESD and ancestral climatic-niche preferences in Catasetinae depicted as traitgrams obtained via ACE analyses of mean values of bioclimatic variables. In all panels, coloured circles denote independent origins of ESD (colour-coded by chronological order). Colour coded nodes and branches denote lineages estimated to have ESD. Grey nodes and branches denote lineages inferred to have evolved alternative sexual systems (i.e. no ESD). Lineages in which ESD has evolved are colour-coded accordingly (Mormo.: Mormodes; Cyc.: Cycnoches). (a) Topological position of ESD origins (for posterior probabilities, see Fig. S6) (b) Annual mean temperature (Bio 1); (c) Mean diurnal range (Bio 2); (d) Isothermality (Bio 3); (e) Temperature seasonality (Bio 4); (f) Maximum temperature of warmest month (Bio 5); (g) Maximum temperature of coldest month (Bio 6); (h) Temperature annual range (Bio 7); (i) Mean temperature of wettest quarter (Bio 8); (j) Mean temperature of driest quarter (Bio 9); (k) Mean temperature of warmest quarter (Bio 10); (l) Mean temperature of coldest quarter (Bio 11); (m) Annual precipitation (Bio 12); (n) Precipitation of wettest month (Bio 13); (o) Precipitation of driest month (Bio 14); (p) Precipitation seasonality (Bio 15); (q) Precipitation of wettest quarter (Bio 16); (r) Precipitation of driest quarter (Bio 17); (s) Precipitation of warmest quarter (Bio 18); (t) Precipitation of coldest quarter (Bio 19); (u) Altitude (meters). Note the little divergence through time of ancestral mean bioclimatic variables between lineages having ESD, and those with alternative sexual systems.

