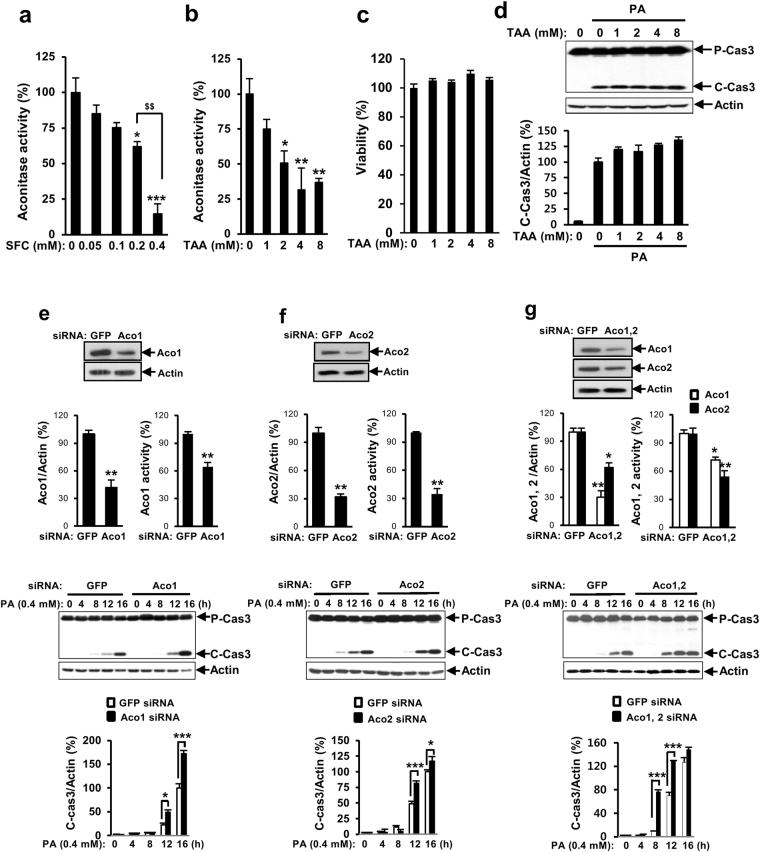
Figure 4.
Aconitase inhibition does not protect palmitate-induced lipotoxicity. INS-1 cells were treated with different concentrations of sodium fluorocitarte (SFC) or trans-aconitic acid (TAA) for 8 h. (a,b) Aconitase activity was measured by aconitase activity assay kit. (c) Cell viability was measured by MTT assay. Data shown are relative activities. Data are expressed as mean ± SE and analyzed by one-way ANOVA. *p < 0.05; **p < 0.01; ***p < 0.001 vs. PBS-treated INS-1 cells. $$ p < 0.01 vs. 0.2 mM SFC-treated INS-1 cells. (d) INS-1 cells were treated with 0.4 mM palmitate (PA) for 16 h in the presence of different concentrations of TAA. Cleaved caspase 3 levels were investigated by immunoblotting with anti-caspase 3 antibodies. Data are presented as mean ± SE and analyzed by one-way ANOVA. (e,f,g) INS-1 cells were transfected with siRNA of green fluorescent protein (GFP), aconitase 1 (Aco1), aconitase 2 (Aco2), or aconitase 1/aconitase 2 (Aco1, 2). After 36 h of incubation, knockdowns of aconitases were determined by immunoblotting with anti-Aco1 or Aco2 antibodies. Aconitase activities were measured by aconitase activity assay kit. Transfected INS-1 cells were treated with 0.4 mM palmitate for indicated time period. Cell death was determined by measuring levels of cleaved caspase 3 in immunoblotting with anti-caspase 3 antibodies. Full-size original blots are presented in supplementary Fig. S6. Data are presented as mean ± SE and analyzed by unpaired Student’s t-test (Immunoblotting for aconitases and activity for aconitases) or two-way ANOVA (Immunoblotting for cleaved caspase 3). *p < 0.05; **p < 0.01; ***p < 0.001 vs. siGFP-transfected INS-1 cells.

