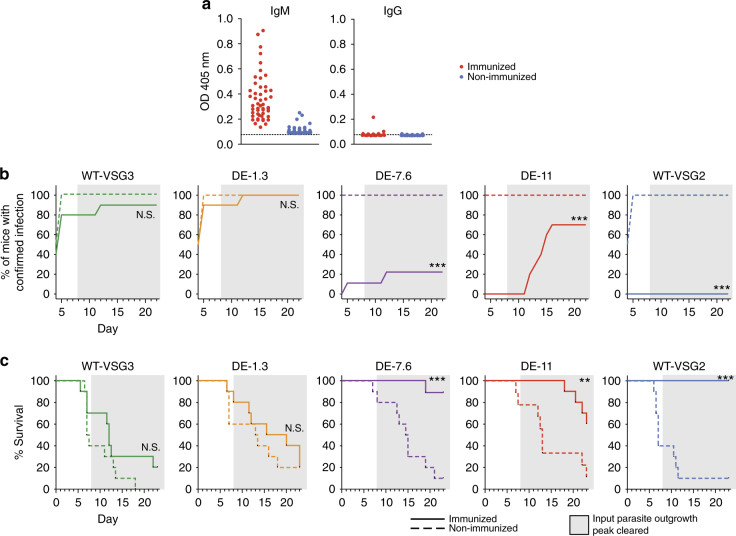
Fig. 3.
Immunization-challenge experiments with DE clones reveal a threshold of immune evasion. a VSG2-specific IgM and IgG Ab titers in the immunized and non-immunized mice (n = 49 mice/group) used for experiments shown in b, c at day 8 post immunization (combined results of three independent experiments). Data show relative titers as measured by ELISA. Dotted lines indicate average background OD in wells incubated with no serum. b, c Non-immunized mice and mice immunized against VSG2 were challenged with the trypanosome clones indicated. b Percentage of mice with confirmed infection over time, and c survival curves for immunization-challenge experiments. X axes indicate day post challenge. Gray shading indicates the period following clearance of the parasitemia peak resulting from outgrowth of input parasites. For b, mice were permanently scored as infected when trypanosomes were first identified via blood smear. For b, c, statistical analysis was performed using the log-rank (Mantel–Cox) test (n = 9 for DE-7.6 immunized and DE-11 non-immunized, 10 for other groups); ***P < 0.001, **0.001 < P < 0.01, N.S., not significant (P > 0.05). Data include combined results of three independent experiments (with n = 4 or 5 mice per experimental group per experiment). One trypanosome clone of each type was used in these experiments

