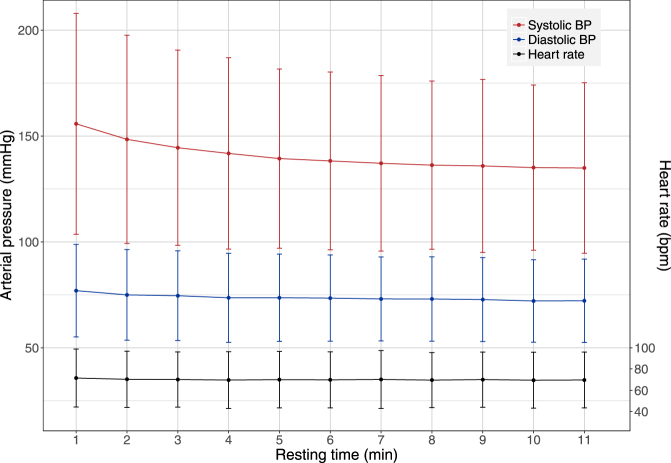
Figure 1.
Evolution of the blood pressure and heart rate during the resting time. Evolution of measured systolic (red) and diastolic (blue) arterial blood pressure with time, expressed as mean and + /−1.96 standard deviation. Also shown, in black, is the evolution of heart rate over the measurement period (slightly displaced not to overlap the diastolic pressure); the scale for the cardiac frequency is given as the axis on the right hand side of the figure.

