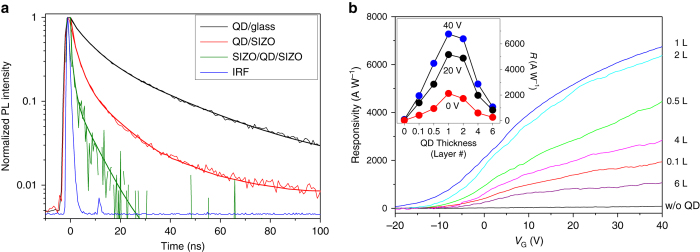
Fig. 3.
Measurement results of fluorescence decays and photoresponses. a Fluorescence decay curves of three different monolayered-red-QD films, i.e., QDs, QDs on SIZO, and SIZO/QD/SIZO (OQO), all on glass substrates. The blue line is the system instrumental response function (IRF). The thicker solid lines are the fitting of each decay curves. b R vs. V G with respect to QD layer thickness for red-QD OQO phototransistors. The incident light at 487-nm wavelength is illuminated with 10-nW power. In all, 0.1 and 0.5 L correspond to areal coverage of 10% and 50% of the monolayered-QD films, respectively. The inset figure shows the R values vs. the QD layer thickness

