Fig. 5.
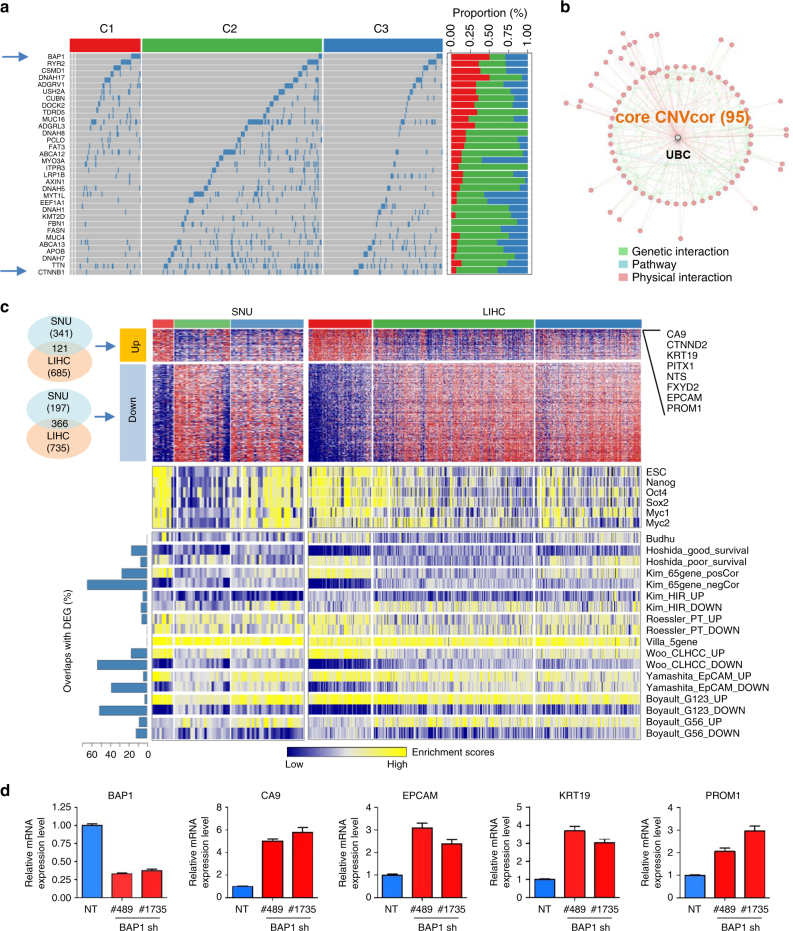
Identification of key molecular features for HCC subtypes. a Differentially mutated genes among the subtypes of LIHC are shown. A total of 37 differentially mutated genes are identified, which have differential mutation rates in C1 tumors compared to C2 or C3 tumors, respectively. The two samples of TCGA-G3-A25X-01 and TCGA-BC-4072-01 with no mutation data were excluded in the analysis (indicated with a right grey color). b Network of CNVcor genes is constructed using physical and genetic interactions from GeneMania software, which identifies the highest interconnecting hub gene, UBC. c Heatmaps show the differentially up- (DEG_UP, n = 121) and down-expressed (DEG_DOWN, n = 366) genes that are commonly found in both SNU and LIHC data sets, respectively (top). Top-ranked DEGs are indicated. The DEGs for SNU data are defined with fold difference >1.4 in comparison of iCl1 tumors with iCl2 or iCl3 tumors, while the DEG for LIHC data are defined with fold difference >2 and permuted Student’s t test P < 0.001 in comparison of the C1 tumors compared to C2 or C3 tumors, respectively. Gene set enrichment scores of the embryonic stem cell (ESC)-related gene sets (middle) and the nine molecular classifiers for HCC (bottom) are shown in SNU and LIHC data sets, respectively. Stemness gene sets of ESC, Nanog, Oct4, Sox2, Myc1, and Myc2, and the nine different HCC classifiers are obtained from previous studies as described in “Methods.” d Huh7 cells stably expressing non-targeting (NT) shRNA and BAP1 shRNA (#489 or #1735) were established. Real time qPCR for BAP1 and stemness genes (CA9, KRT19, EPCAM, and PROM1) was performed. The expression values represent means ± S.E.M. of three independent experiments

