Fig. 6.
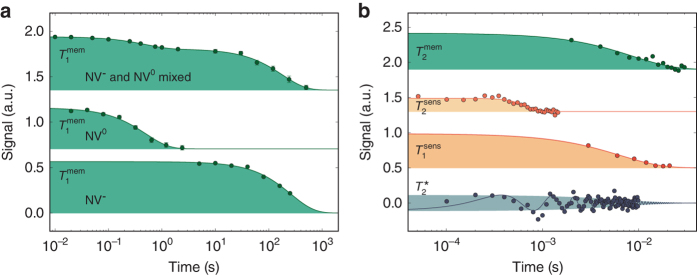
Decay constants of sensor, memory, and target. a Lifetime of the memory spin. The uppermost graph shows the lifetime at 1.35 T. The data show two different decay constants, 0.49 and 180 s. The fast decay corresponds to those measurement runs, during which the NV center resides in the NV0 charge state, the slow decay corresponds to the NV− case. By using charge state readout (see ref. 37) and data post selection, one can isolate pure NV0 and NV− measurements. The results for 1.5 T are shown in the middle (NV0) and lower (NV−) line. b The sensor performance, including the coherence of the probed spins, without any dissipative decoupling. The uppermost line shows the coherence decay of the memory spin, with a decay constant of = (8.6 ± 1.3) ms. Below, the orange lines show (from top to bottom) the coherence ( = 688 ± 31 μs) and longitudinal relaxation ( = 6.4 ± 0.6 ms) of the sensor spin. The black line shows the coherence of the target spins (without any decoupling from sensor dissipation), with a decay constant of = 6.78 ± 1.3 ms

