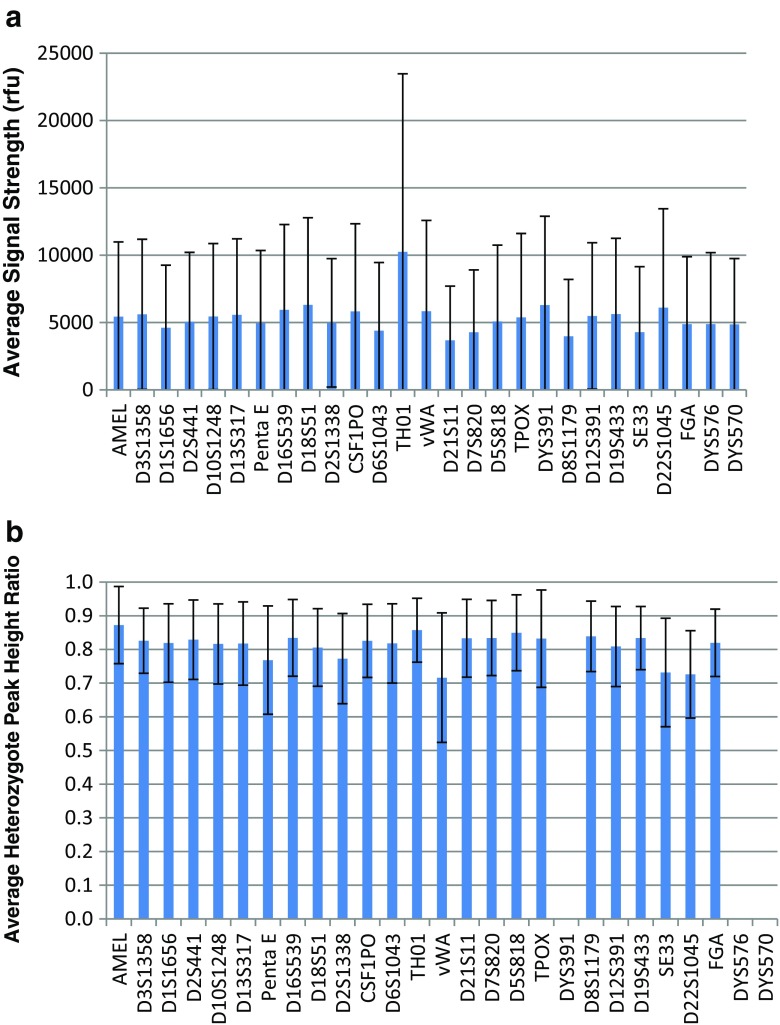
Fig. 6.
a Average signal strength from 220 STR profiles processed with the FlexPlex27 assay and ANDE 6C Rapid DNA system. Standard deviations are indicated. b Average heterozygote peak height ratio from the same set of STR profiles as in Fig. 5a. Standard deviations are indicated

