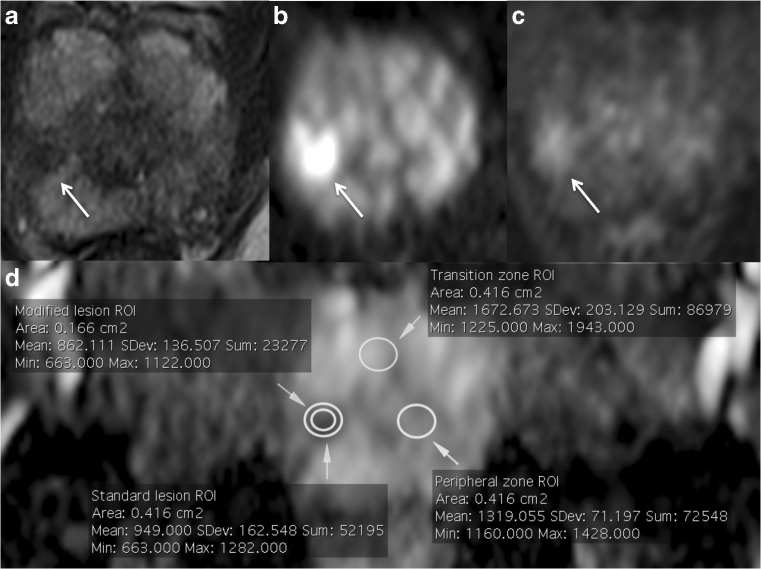
Fig. 1.
The arrows show a tumour in the right mid-apex peripheral zone of the prostate on T2-weighted (a), diffusion-weighted (b) and dynamic contrast-enhanced (c) imaging, and how all regions of interest (ROIs) were positioned on the same slice of the apparent diffusion coefficient (ADC) map (d) accordingly

