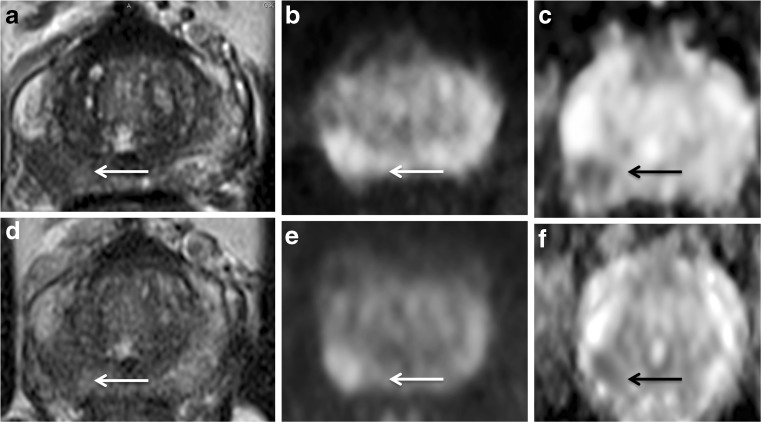
Fig. 3.
63-year-old man with a presenting PSA of 5.81 ng/mL and Gleason Score 3 + 4. At baseline MRI, the pathological area of decreased signal intensity in the mid-right peripheral (arrow) on the axial T2-weighted image (A) corresponds to the high-signal intensity on the DWI image (B) and low-signal intensity on the ADC map (C), with a reduced ADC value (0.88 x 10⁻³ mm2/s). At 6-month MRI (PSA: 2.41 ng/mL) the pathological area is less recognisable (arrow) in all the three scans (D,E,F) and an increase in the ADC value was observed (1.01 x 10⁻³ mm2/s). There was a decrease in conspicuity of 11% on the ADC map. This patient was in the dutasteride arm

