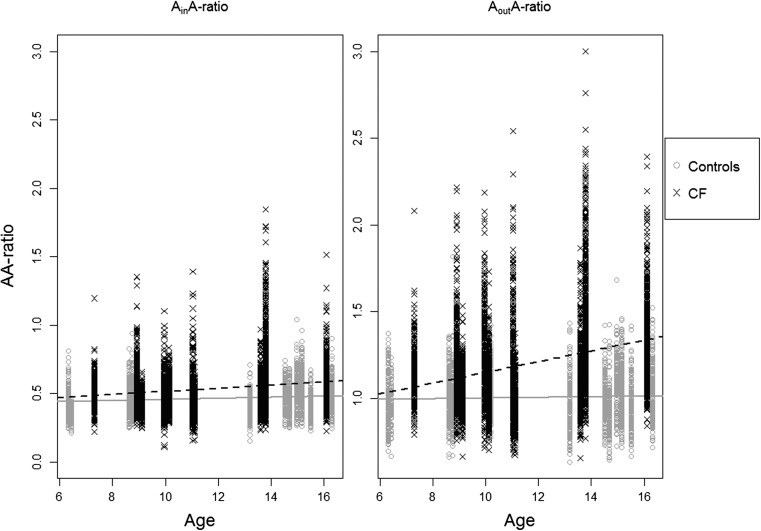
Fig. 4.
The AA-ratio is plotted as a function of age, for AinA (left) and AoutA (right). The cystic fibrosis (CF) patients are depicted as black X and dashed line and the control patients as grey O and solid lines. AinA-ratio remained constant with increasing age in the CF (value=0.010, p=0.28) and control (value=0.006, p=0.22) groups. The AoutA-ratio in the CF group (value=0.026, p=0.10) and control group (value=0.002, p=0.52) also did not increase significantly with age

