
Fig. 1.
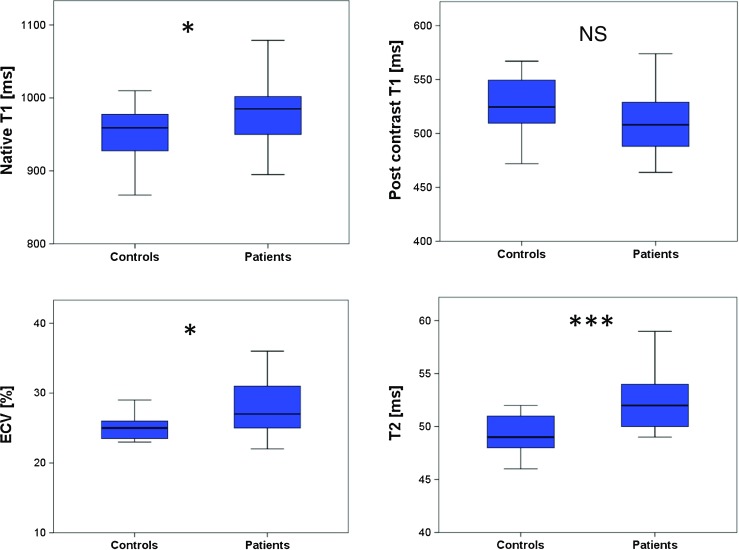
Box plots for median native T1, post contrast T1, extracellular volume fraction (ECV), and T2 mapping in controls and RA patients; the centre line in each box represents the median, whereas the lower and upper limits of each box represent the 25th and 75th percentiles, respectively. Except for post contrast T1, RA patients showed values which were significantly different to the values of the control group: *p ≤ 0.05; ***p ≤ 0.001