Fig. 1.
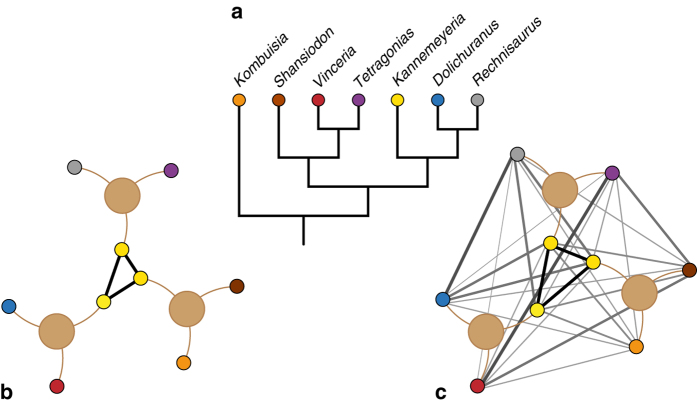
Schematic illustration of network biogeography methods. a Simplified phylogeny of Dicynodontia. b, c Taxon-locality networks. Localities are indicated by the large, pale brown circles, taxa are coloured as in (a). Taxa are connected by brown lines to the locality at which they occur. b Rescaled non-phylogenetic biogeographic connectedness (BC) of Sidor et al.3. A single taxon, Kannemeyeria (yellow), is present at all three localities, resulting in a link of value = 1 (solid black line) between each locality. c Phylogenetic biogeographic connectedness (pBC), as proposed here. Links (grey lines) between taxa from different localities are weighted inversely to their phylogenetic relatedness. Line thickness and shade is proportional to the strength of the link (and thus inversely proportional to phylogenetic distance between the two taxa)

