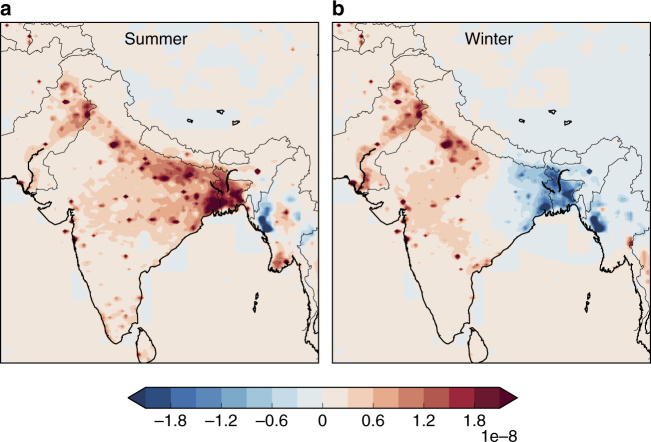
Fig. 2.
Differences in emissions between seasons. a Difference between the average summer (June–Sept) or b average winter (Jan–Feb) peak emission periods, and the average of spring/autumn minimum emission periods (March–May, October–December) in g m−2 s−1. Scaling factors to the prior flux map for each month were estimated for ~40 spatial basis functions within this domain; the prior map was scaled up or down by this factor for each basis function

