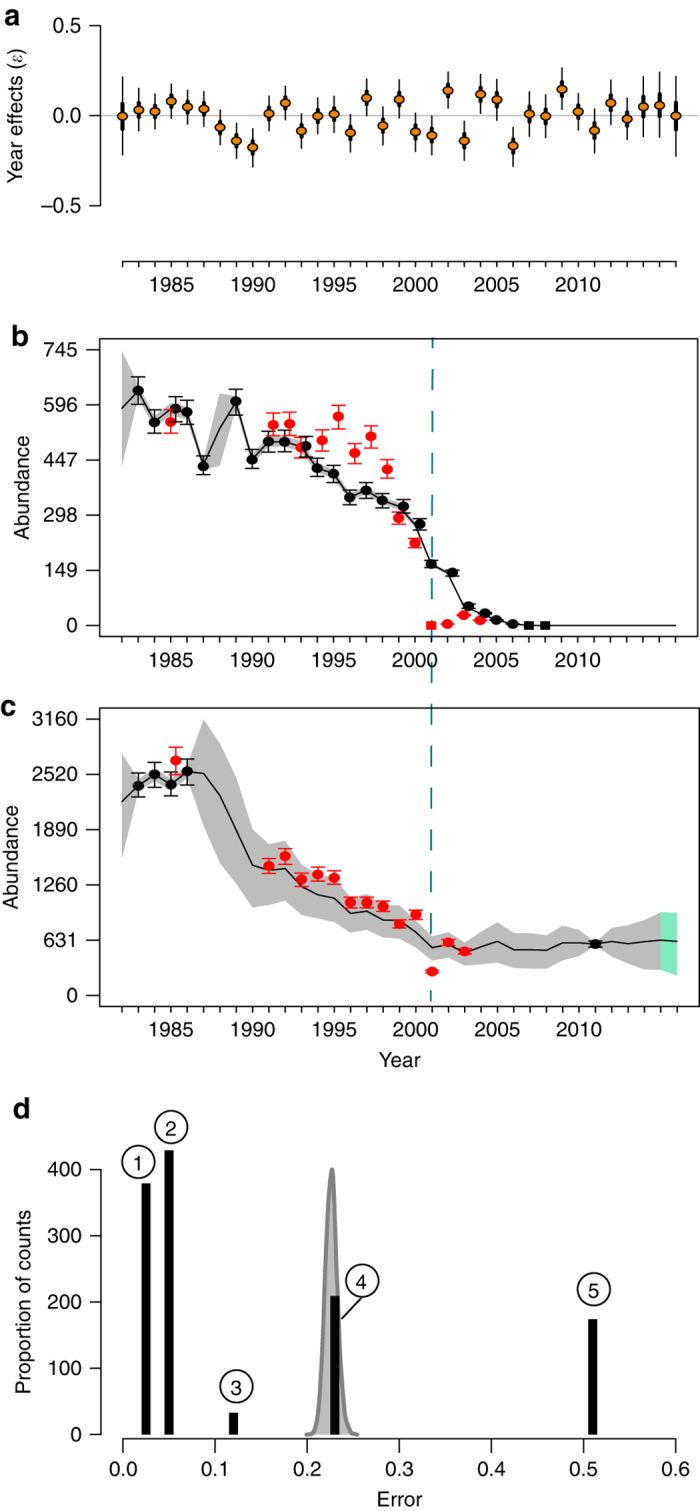
Fig. 3.

Impact of stochasticity on population dynamics. a Stochastic year effects (ε y) on Adélie population growth rate (r). Thick lines represent the 50% equal-tailed credible intervals, thin lines represent the 95% equal-tailed credible intervals, and circles are the posterior medians. b, c Annual Adélie abundance at b, Litchfield Island, and c Humble Island, with Adélie nest (black circles) or chick (red circles) counts and the seasons where no nests (black squares) or chicks (red squares) were observed. The gray (1982–2015) and green (2016) shaded areas represent the 75% highest posterior density credible intervals; black lines are the posterior medians. The error bars represent the 90% highest posterior density credible intervals from the posterior predictive distributions for the nest or chick counts. Note that 2016 is beyond the end of our time series; all abundance estimates from 2016 reflect population forecasts from the model. d Histogram (black bars) of observation errors (σ observation) associated with all counts included in the Adélie model overlaying a density plot (in gray) of the posterior distribution for the process error (σ process) from the Adélie model. The numbers within circles over the black bars represent the accuracy code associated with each of these observation errors (Supplementary Data 1)
