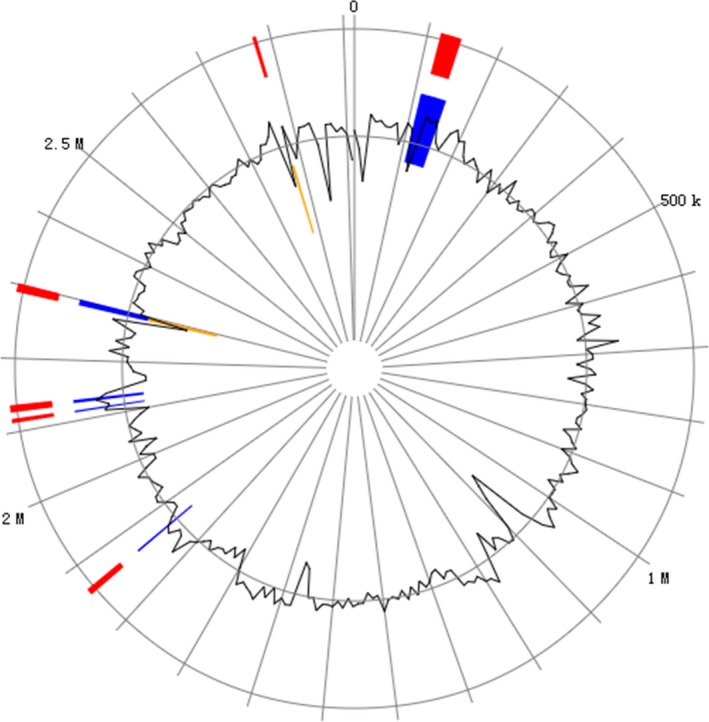
Figure 4.

Genomic islands distribution of E. arabatum W‐01. Using IslandViewer to predict GEI. The circle represents a single chromosome, with red bars around the perimeter indicating the locations of all GEI predictions across the three methods. Within the circle, GEI predictions are differentiated by prediction method with IslandPath‐DIMOB (blue), SIGI‐HMM (orange), and IslandPick (green), all shown
